
Image
|
Figure Caption
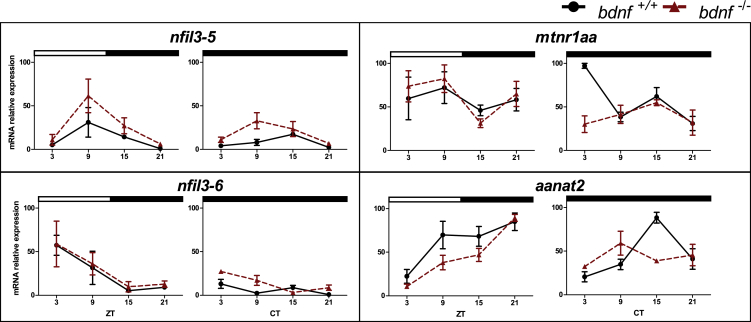
Fig. 5
Daily and circadian expression levels of clock-controlled genes in zebrafish larvae
qPCR analysis of clock-controlled gene expression in larvae of zebrafish exposed to LD cycles or DD. For all panels, each point represents the mean ± SEM (n = 5). bdnf+/+ = solid line; bdnf−/− = dotted line. For more details, see Figure 4.
Figure Data
Acknowledgments
This image is the copyrighted work of the attributed author or publisher, and
ZFIN has permission only to display this image to its users.
Additional permissions should be obtained from the applicable author or publisher of the image.
Full text @ iScience