
Image
|
Figure Caption
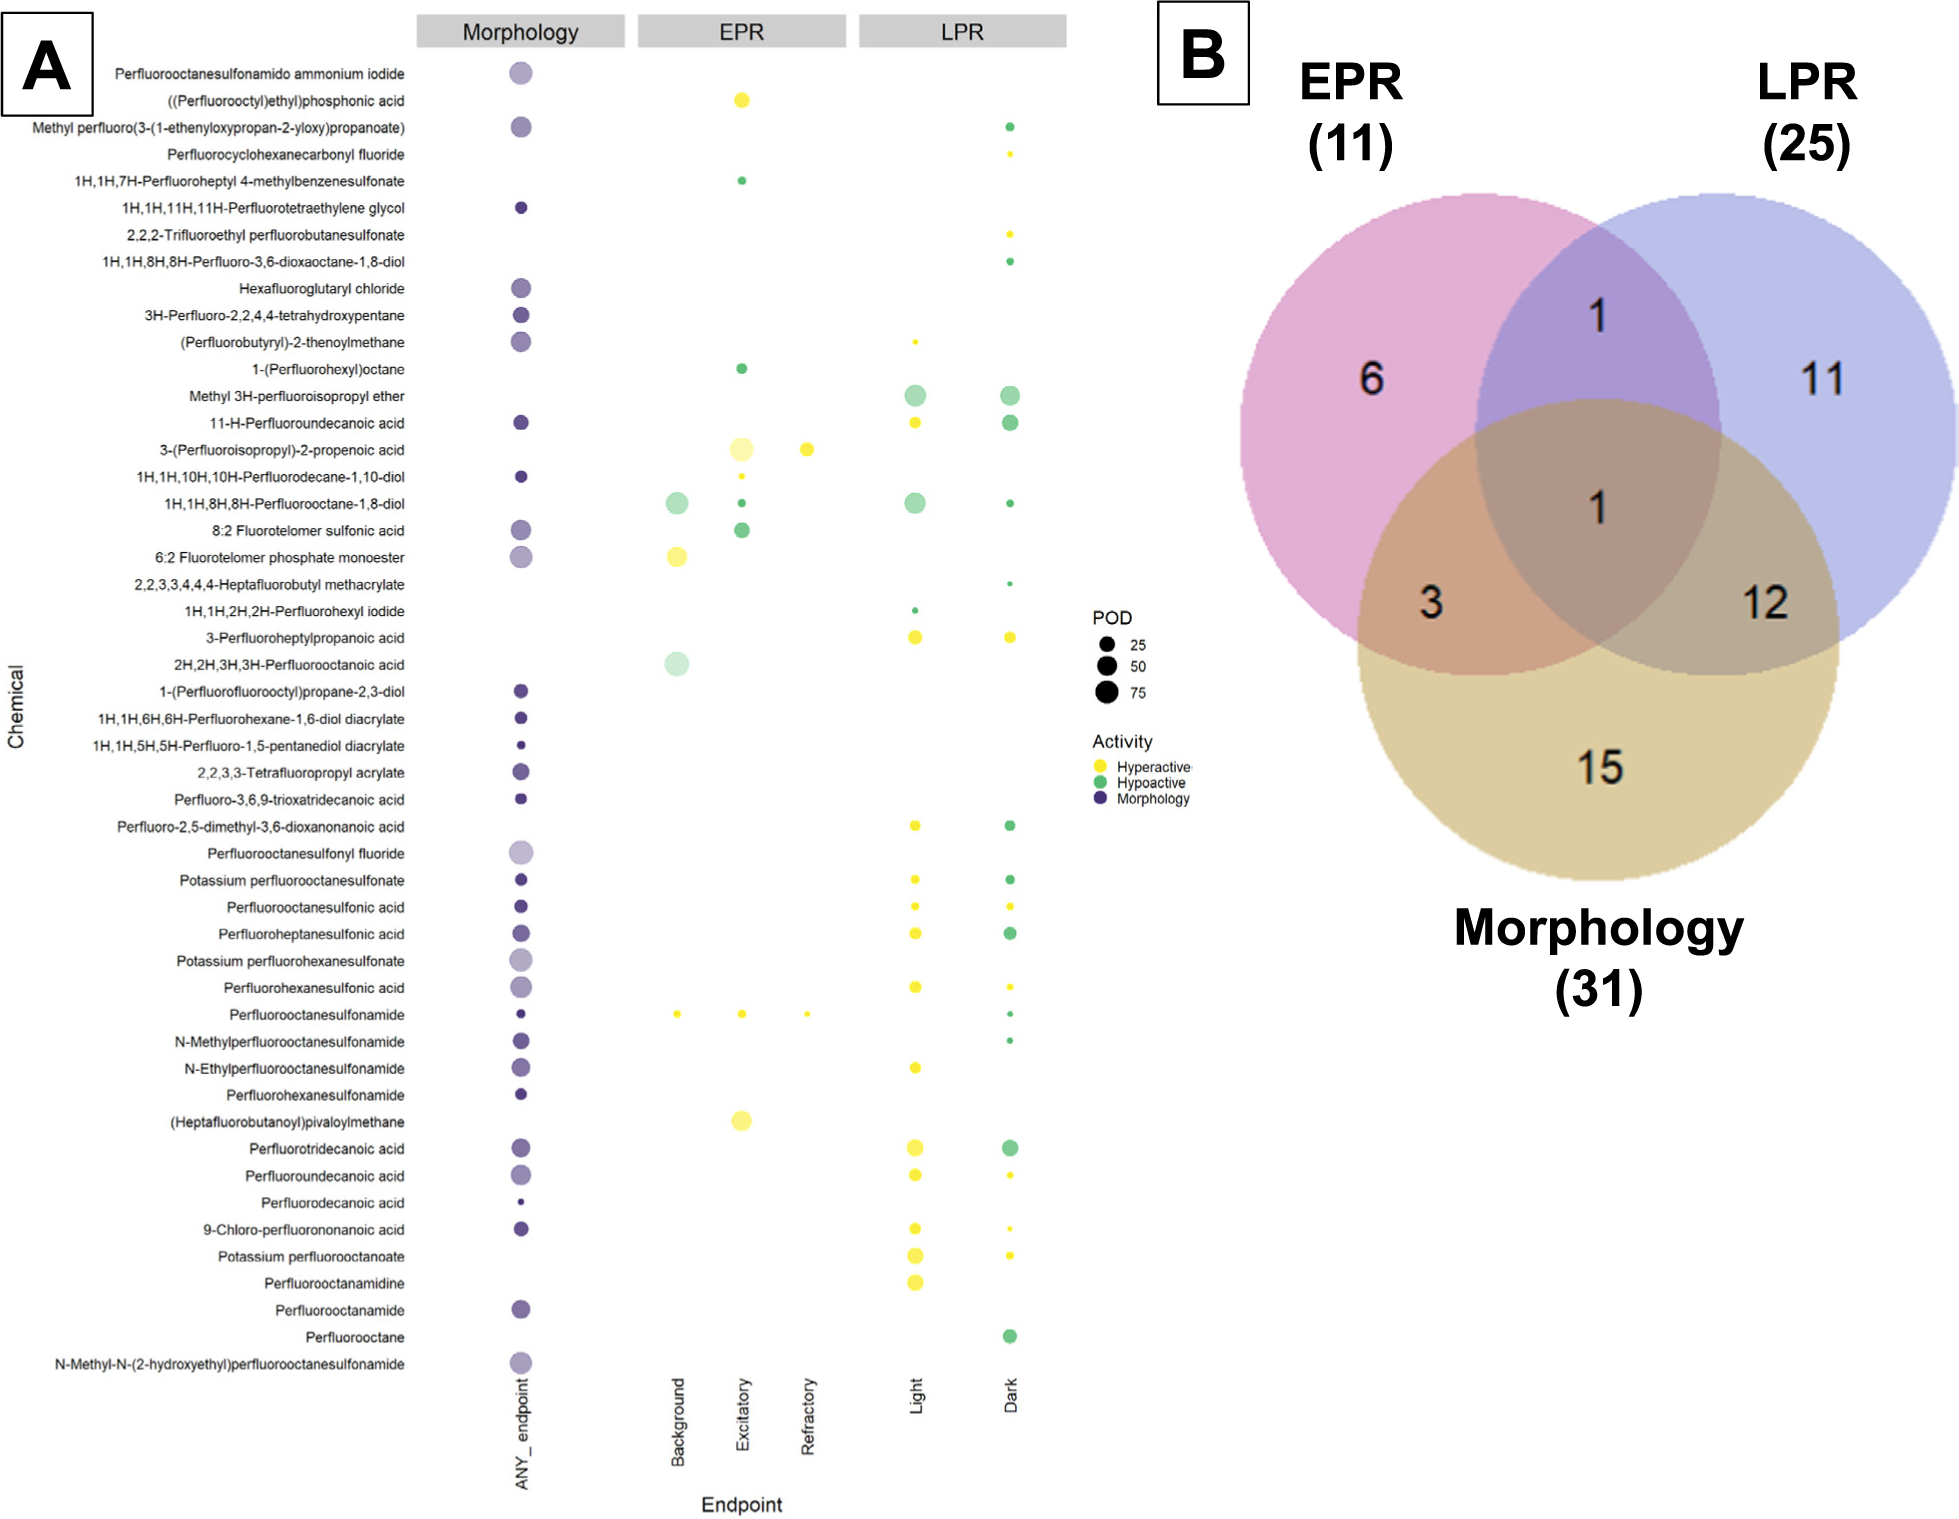
Fig. 2
Developmental toxicity screening using the embryonic zebrafish model.
A. Summary of Developmental Toxicity Bioactivity. Dots are colored by their activity (hypo vs hyper), their size represents Point Of Departure (POD) estimate (larger = higher POD), and transparency levels represent the potency (darker = more potent). B. Venn Diagram of the number of PFAS that were bioactive in morphology, embryonic photomotor response (EPR), and larval photomotor response (LPR) assays.
Acknowledgments
This image is the copyrighted work of the attributed author or publisher, and
ZFIN has permission only to display this image to its users.
Additional permissions should be obtained from the applicable author or publisher of the image.
Reprinted from Journal of hazardous materials, 431, Truong, L., Rericha, Y., Thunga, P., Marvel, S., Wallis, D., Simonich, M.T., Field, J.A., Cao, D., Reif, D.M., Tanguay, R.L., Systematic developmental toxicity assessment of a structurally diverse library of PFAS in zebrafish, 128615, Copyright (2022) with permission from Elsevier. Full text @ J. Hazard. Mater.