
|
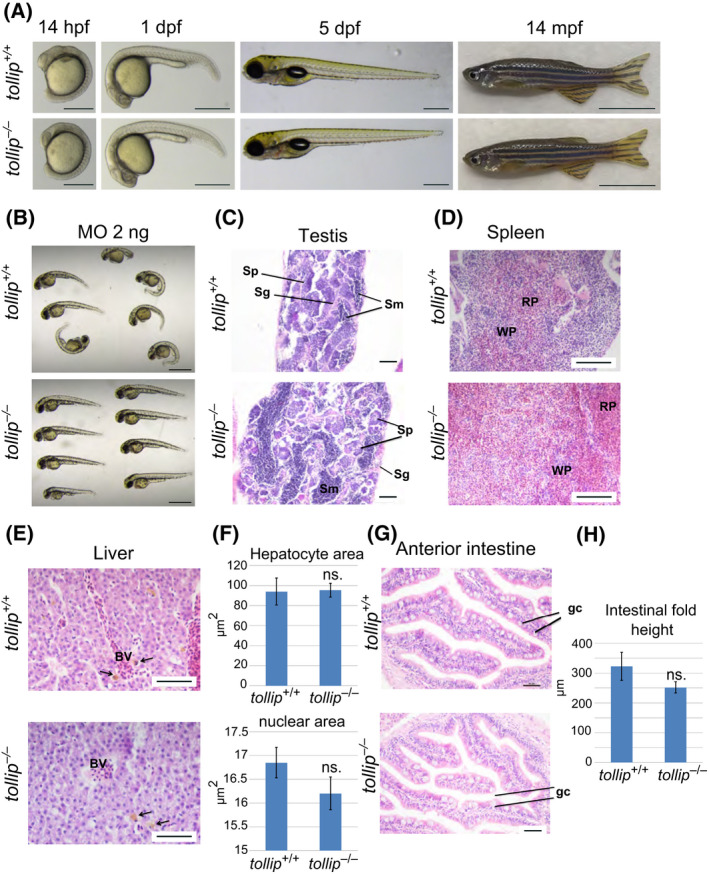
Fig. 2
Knockout of the tollip gene has no effect on the fish morphology. (A) Wild‐type (tollip +/+) and mutant (tollip −/−) embryos at 14 h, and 1 and 5 days post fertilization (hpf, dpf) show normal development and morphology. Scale bar 500 μm. Right image, wild‐type (tollip +/+) and mutant (tollip −/−) male adults at 14 mpf are without visible body morphological defects. Scale bar 1 cm. (B) Morphology of wild‐type tollip +/+ and mutant tollip −/− embryos injected with 2 ng of translation‐blocking morpholino targeting tollip (MO), observed at 48 hpf. Scale bar 1 mm. (C–H) Histology and quantitative analysis of hematoxylin and eosin stained sections of testes (C), spleen (D), liver (E, F), and anterior intestine (G, H) with specific cells and structures marked, including spermatozoa (Sm), spermatogonia (Sg), spermatocytes (Sp), red pulp (RP), white pulp (WP), blood vessels (BV), liver macrophages (arrows in E), and goblet cells (gc). For liver analyses, areas of hepatocytes and their nuclei are quantified in F. The height of intestinal folds is quantified in H. Scale bar 50 µm (C, G), 100 µm (D, E). Bars represent the means ± SEM (n = 3, each encompassing 40–60 (liver) or 25 (intestine) measurements from 5 selected areas) t‐test, ns.—nonsignificant.