IMAGE

Figure 4

ID
ZDB-IMAGE-220801-55
Source
Figures for Sabharwal et al., 2022
Image
Figure Caption

Figure 4

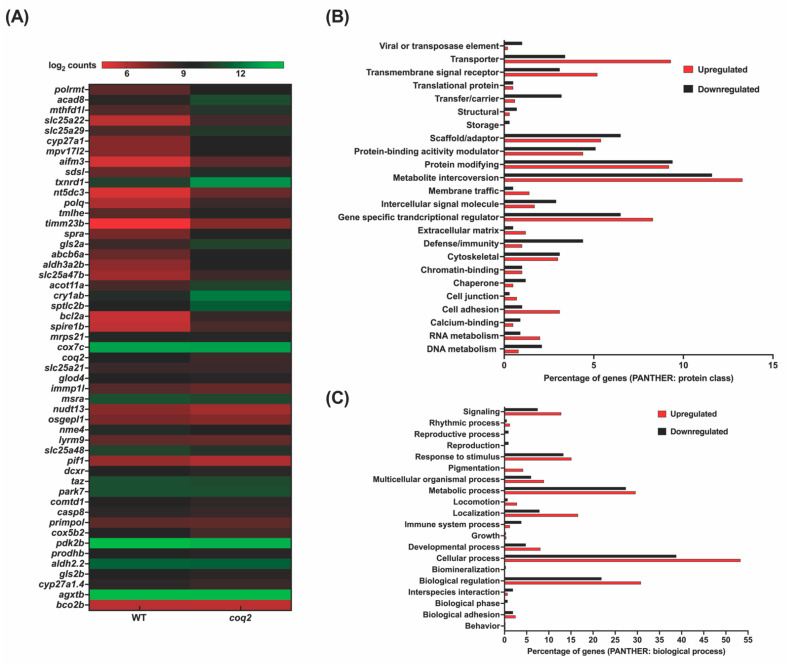
RNAseq analysis of coq2 mutants: (A): Heat map visualization of expression of zebrafish orthologs for human MitoCarta genes. The gradient color scale represents the log2CPM value obtained for each of the zebrafish mitochondrial orthologs in the two datasets. (B,C): PANTHER classification for all the differentially expressed genes in the homozygous mutant according to protein class (B) and biological process (C). Each histogram represents the percentage of genes falling in each of the categories.

Acknowledgments
This image is the copyrighted work of the attributed author or publisher, and ZFIN has permission only to display this image to its users. Additional permissions should be obtained from the applicable author or publisher of the image. Full text @ Genes (Basel)