
Image
|
Figure Caption
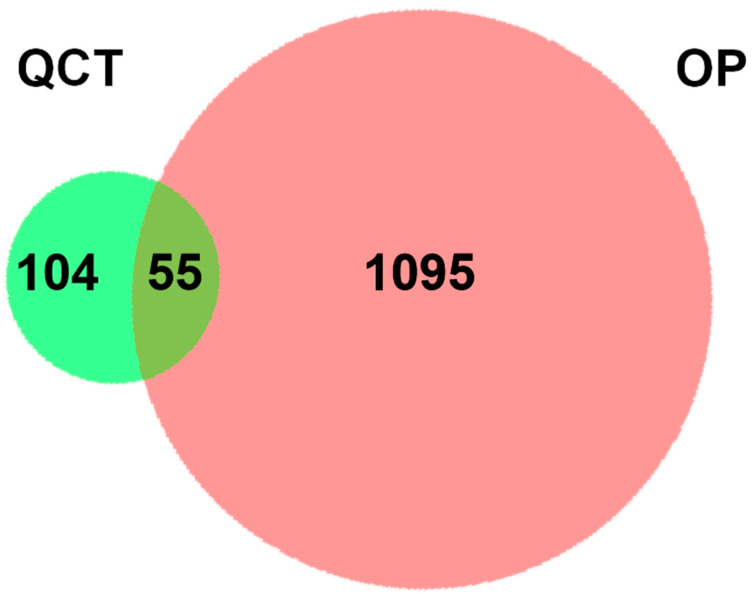
Figure 1
A two-set Venn diagram illustrating the relationship between QCT and OP-related targets. Light green and red represent QCT and OP-related targets, respectively. The intersection depicts a total of 55 potential pharmacological targets for QCT in the treatment of OP.
Acknowledgments
This image is the copyrighted work of the attributed author or publisher, and
ZFIN has permission only to display this image to its users.
Additional permissions should be obtained from the applicable author or publisher of the image.
Full text @ Life (Basel)