IMAGE

Figure 5

ID
ZDB-IMAGE-220801-105
Source
Figures for Yang et al., 2022
Image
Figure Caption

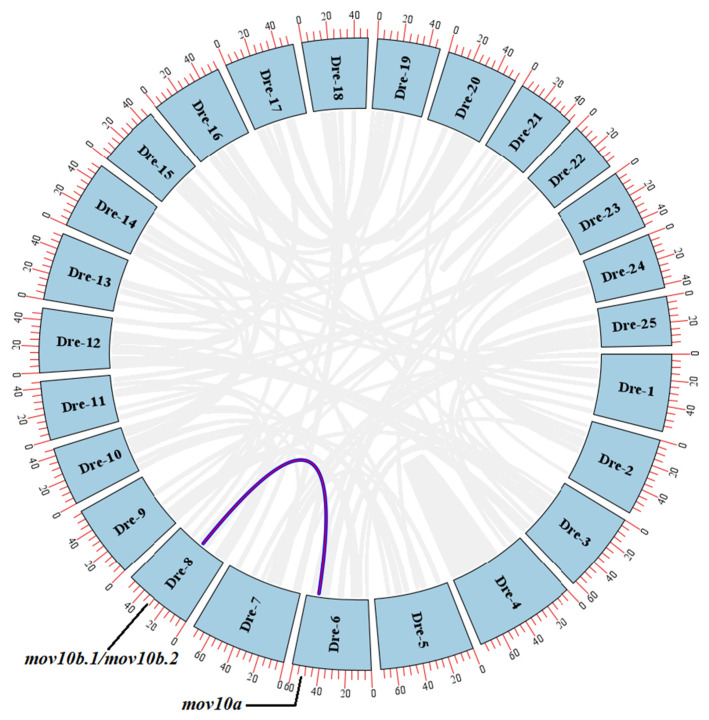
Figure 5

The circos plot of mov10s in zebrafish inter-chromosomal synteny analyses. The blue boxes represent the numbered zebrafish chromosomes. The outer red scales indicate the lengths of the chromosome sequences, with each scale representing 5 MB. The gray lines inside between the two chromosomes indicate the homologies between the genes, while the other colored lines indicated them between mov10s. Dre, Danio rerio.

Acknowledgments
This image is the copyrighted work of the attributed author or publisher, and ZFIN has permission only to display this image to its users. Additional permissions should be obtained from the applicable author or publisher of the image. Full text @ Int. J. Mol. Sci.