
|
FIGURE 1
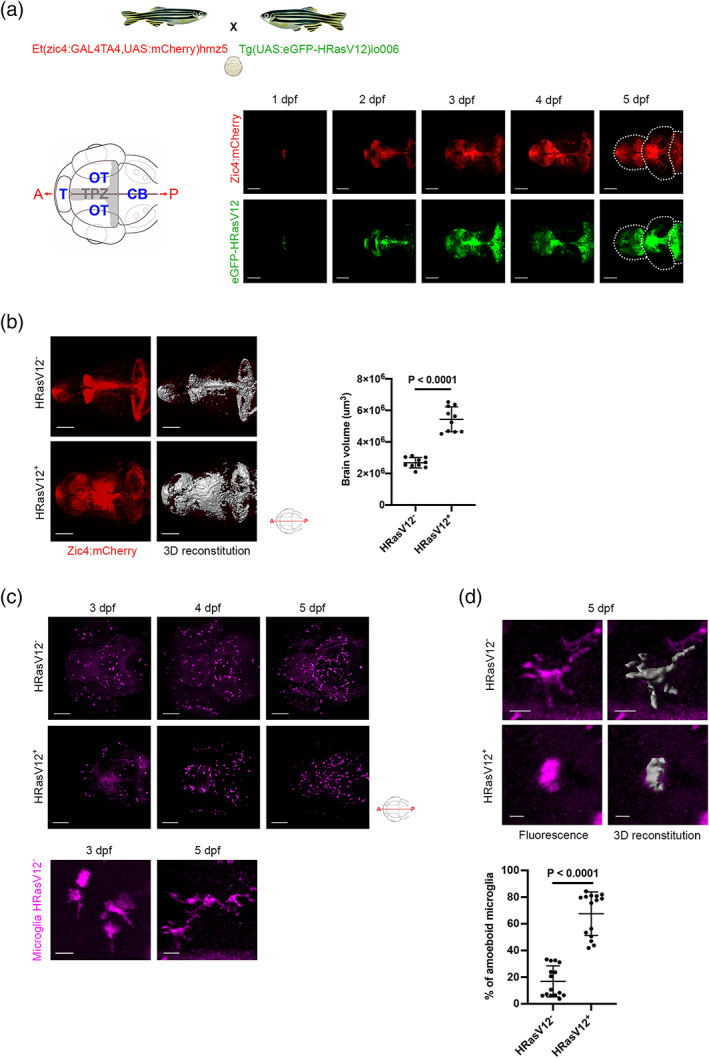
HRasV12 expression in the proliferating regions of the developing CNS alters microglia morphology. (a) Schematic representation of the zebrafish germline system used to induce HRasV12 expression based on the outcross of the indicated fish lines. Schematic anterior‐posterior dorsal view of the brain representing the main sub‐divisions: telencephalon (T), optic tectum (OT) cerebellum (CB) and tectal proliferation zone (TPZ) in gray. Confocal images showing mCherry and eGFP‐HRasV12 fluorescent signal in the proliferating regions of the developing brain of HRasV12+ larvae from 1 to 5 dpf. White dotted lines mark the main brain subdivisions. Scale bar represents 100 μm. (b) Brain volume was assessed using Imaris surface tool to build the segmented images (right panels) of the mCherry signal (left panels) of proliferating regions of the developing brain from 5 dpf HRasV12− (top panels) and HRasV12+ (bottom panels). Scale bar represents 100 μm. Brain volumes of 5 dpf HRasV12− and HRasV12+ larvae were quantified. HRasV12−: