IMAGE

Fig. 4

ID
ZDB-IMAGE-220725-4
Source
Figures for Ciampi et al., 2022
Image
Figure Caption

Fig. 4

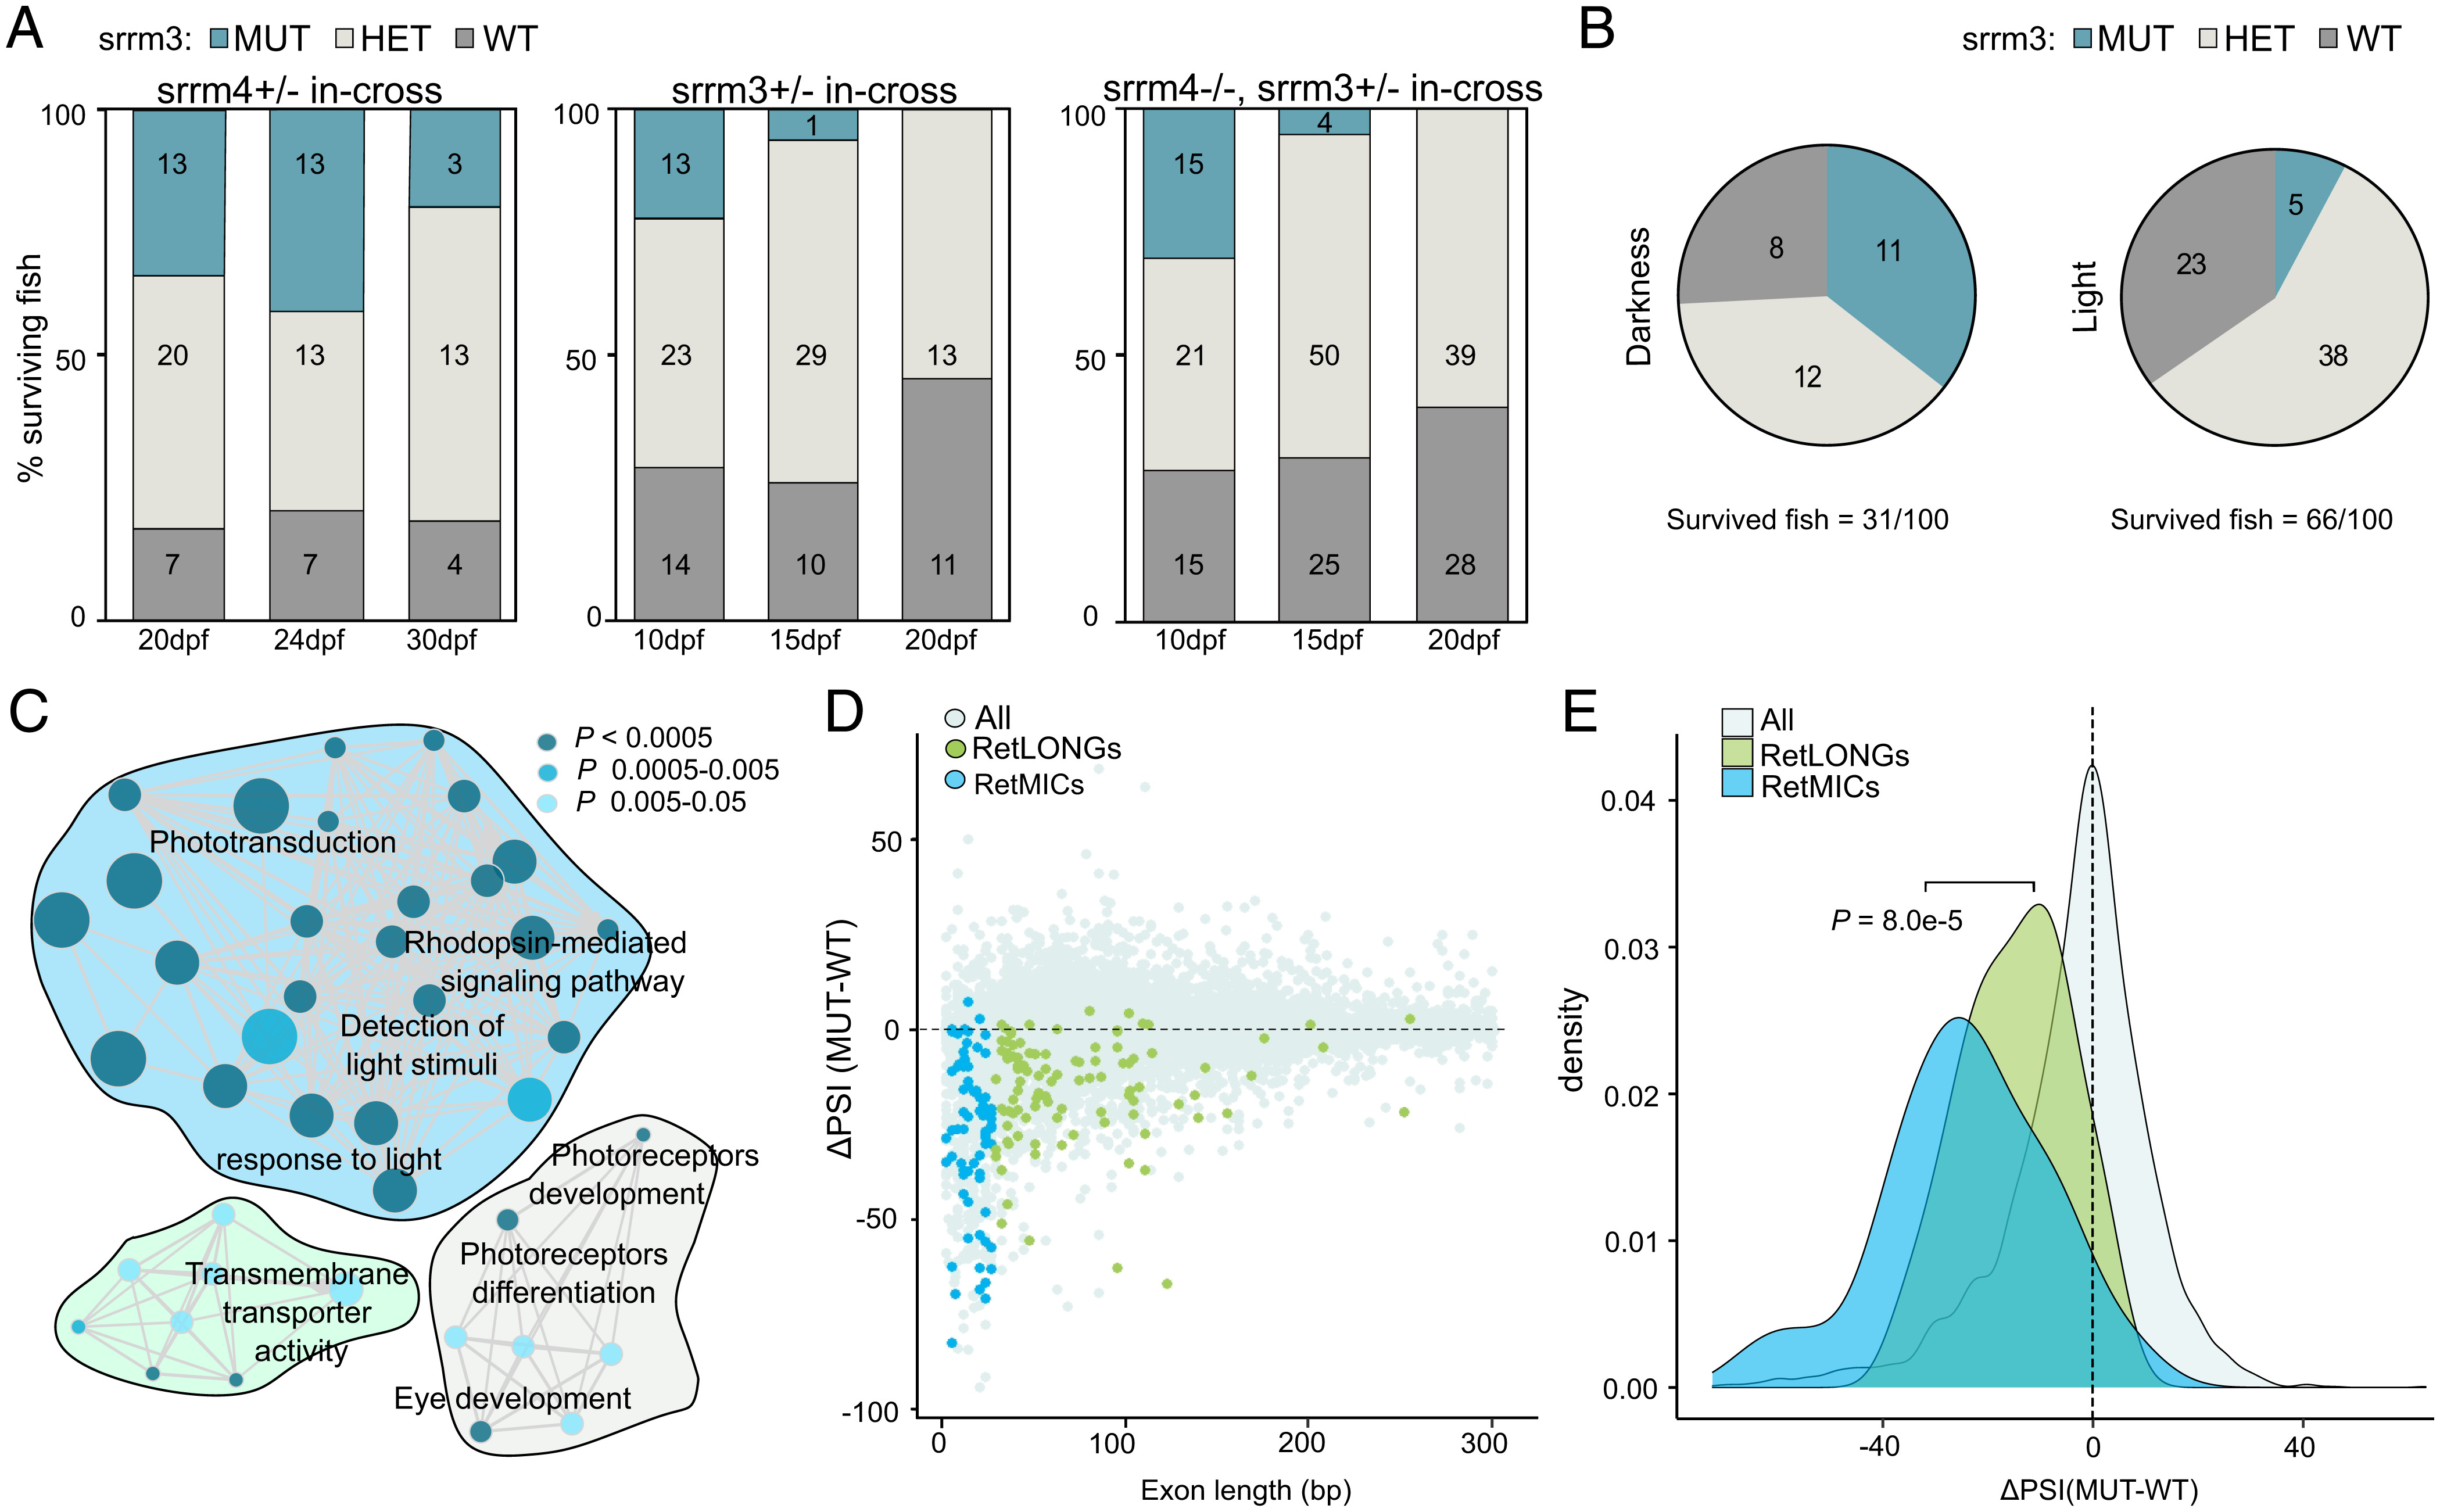
srrm3 depletion in zebrafish causes early lethality and RetMIC down-regulation. (A) Genotype distribution for surviving larvae at different time points from in-crosses of srrm4+/−, srrm3+/−, or srrm4−/−;srrm3+/− (double mutants) fish. (B) Genotype distribution for surviving larvae at 13 dpf from a srrm3+/− in-cross in dark and control light conditions. For both A and B, the number of animals per genotype and time-point is indicated in the plots. (C) Enriched biological process GO terms for genes down-regulated in srrm3 homozygous mutants (MUT) eyes at 5 dpf [log2FC(MUT/WT) ≤ −1.5]. GO terms are grouped by ClueGO into three networks according to their GO groups. GO groups are highlighted using three different arbitrary colors, as listed in Dataset S9. P values are corrected with Bonferroni step down. (D) Change in inclusion levels [ΔPSI (MUT-WT)] quantified using vast-tools for all exons shorter than 300 bp with sufficient read coverage in WT and srrm3 MUT eyes at 5 dpf. Blue/green dots correspond to RetMICs and RetLONGs, respectively. (E) Density plots for ΔPSI distributions of RetMICs, RetLONGs, and other alternative exons (10 < PSI < 90 in WT and MUT at 5 dpf) (P = 8.0e-5; Wilcoxon rank-sum test).

Figure Data
Acknowledgments
This image is the copyrighted work of the attributed author or publisher, and ZFIN has permission only to display this image to its users. Additional permissions should be obtained from the applicable author or publisher of the image. Full text @ Proc. Natl. Acad. Sci. USA