Fig. 2
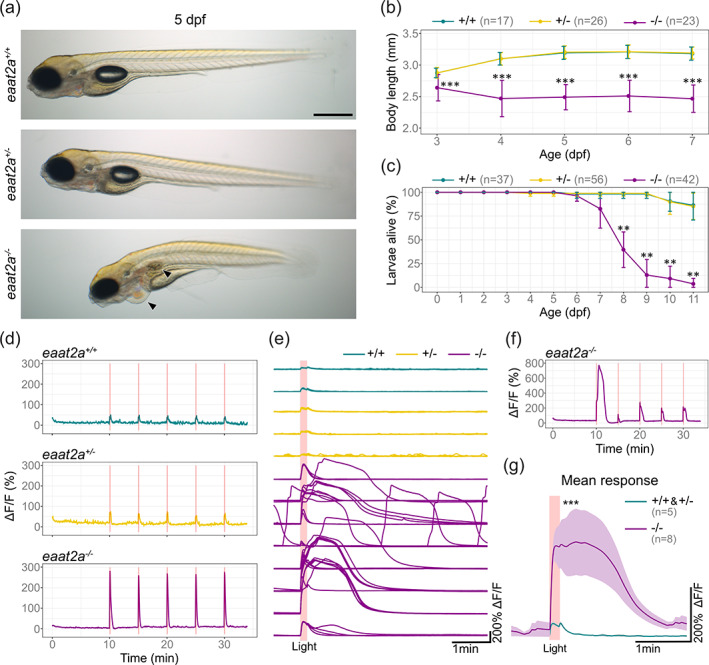
Knockout of eaat2a leads to hyperexcitability in response to light stimulation, morphological defects and larval lethality. (a) Lateral view of 5 dpf eaat2a mutants. eaat2a −/− larvae (bottom) are slightly curved, do not have an inflated swim bladder and develop pericardial edema (arrowheads). eaat2a +/+ (top) and eaat2a +/− (middle) larvae are indistinguishable. Scale bar is 500 μm. (b) Spinal cord length analysis of eaat2a mutants at consecutive days reveals a smaller body size in eaat2a −/− (magenta) compared to their eaat2a +/− (yellow) and eaat2a +/+ (cyan) siblings. Error bars show SD. (c) Mean survival of eaat2a mutants. Error bars show SD. (d) Whole‐brain neuronal activity (elavl3:GCaMP6s signal) of three representative eaat2a mutant larvae (eaat2a +/+ in cyan, eaat2a +/− in yellow and eaat2a −/− in magenta) exposed to five 10‐second light stimuli with 5‐minute interstimulus interval. (e) Changes in fluorescence over time (ΔF/F0) per larvae aligned at the onset of light stimuli (red line). (f) ΔF/F0 trace of an example eaat2a −/− larva with diverse responses to light‐stimuli. (g) Mean responses to five light stimuli per fish in 5 dpf eaat2a +/+ and eaat2a +/− (cyan, n = 5), and eaat2a −/− (magenta, n = 8) zebrafish larvae. Shaded area represents SEM. Significance level: ***p < .001, **p < .01, Dunn Kruskal Wallis multiple comparison test (b, c) or Wilcoxon rank‐sum test (g). All statistics in Supplementary Table 3

