
|
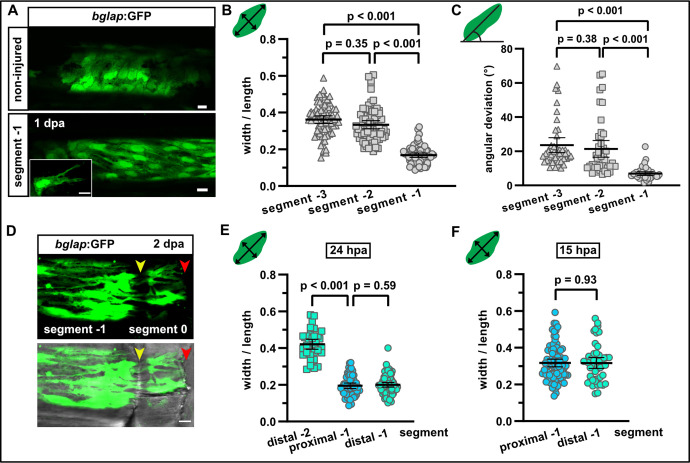
Fig. 2
(A) bglap:GFP+ osteoblast morphology in a non-injured fin (upper panel) and in segment –1 at 1 day post amputation (dpa) (lower panel). Scale bar, 10 µm. (B) Quantification of bglap:GFP+ osteoblast roundness as width/length ratio at 1 dpa. Osteoblasts are more elongated in segment –1. N (experiments)=1, n (fins)=5, n (rays)=5, n (cells)=72. Error bars represent 95% CI. Kruskal-Wallis test. (C) Quantification of bglap:GFP+ osteoblast orientation as angular deviation from the proximodistal axis at 1 dpa. In segment –1, osteoblasts display increased alignment along the axis. N (experiments)=1, n (fins)=5, n (rays)=5, n (cells)=44. Error bars represent 95% CI. Kruskal-Wallis test. (D) At 2 dpa, bglap:GFP+ osteoblasts can be observed within the distal joint of segment –1, and GFP+ protrusions can be seen spanning the joint, indicating that osteoblasts migrate through the joint. Yellow arrowheads, joints; red arrowheads, amputation plane. Scale bar, 10 µm. (E) Osteoblast roundness in distal and proximal parts of segments (40% of total segment length from the respective end) at 24 hpa. No difference within segment –1 can be detected. N (experiments)=1, n (fins)=5, n (rays)=5, n (cells)=34 (segment –2), 55 (proximal segment –1), 78 (distal segment –1). Error bars represent 95% CI. Mann-Whitney test. (F) Osteoblast roundness in distal and proximal parts of segment –1 at 15 hpa. No difference within segment –1 can be detected. N (experiments)=1, n (fins)=6, n (rays)=15, n (cells)=82 (proximal), 49 (distal). Error bars represent 95% CI. Mann-Whitney test. The observed relative difference is 0.3%, the calculated smallest significant difference 13%, which is smaller than what we observe between segment –2 and segment –1 (B, 54%).