
|
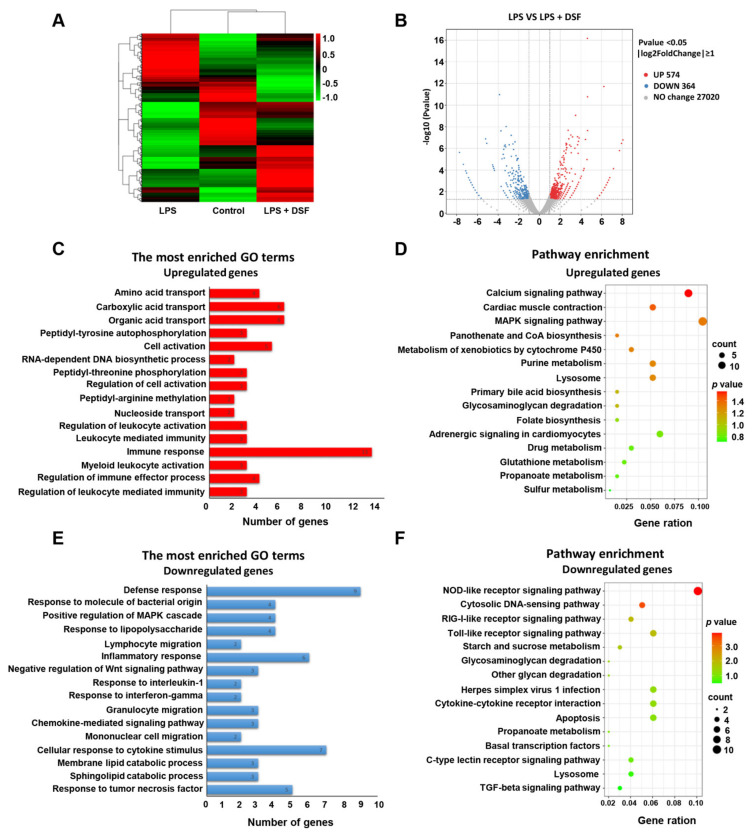
Fig. 6
Transcriptome analysis of differentially expressed genes between LPS and LPS + DSF groups. (A) Heat map representation showing a total of 2029 DGEs in control, LPS- and LPS + DSF-treated zebrafish embryos. (B) Volcano plots show a total of 938 DGEs in LPS and LPS + DSF groups. (C) GO term analysis and (D) KEGG pathway analysis for up-regulating DEGs in LPS + DSF zebrafish embryos compared to the LPS group. (E) GO term analysis and (F) KEGG pathway analysis of down-regulated DEGs in LPS + DSF zebrafish embryos compared to the LPS group. The size of the dot indicates the number of genes enriched in an individual item. The color of the dot represents the p value.