
|
Fig. 1
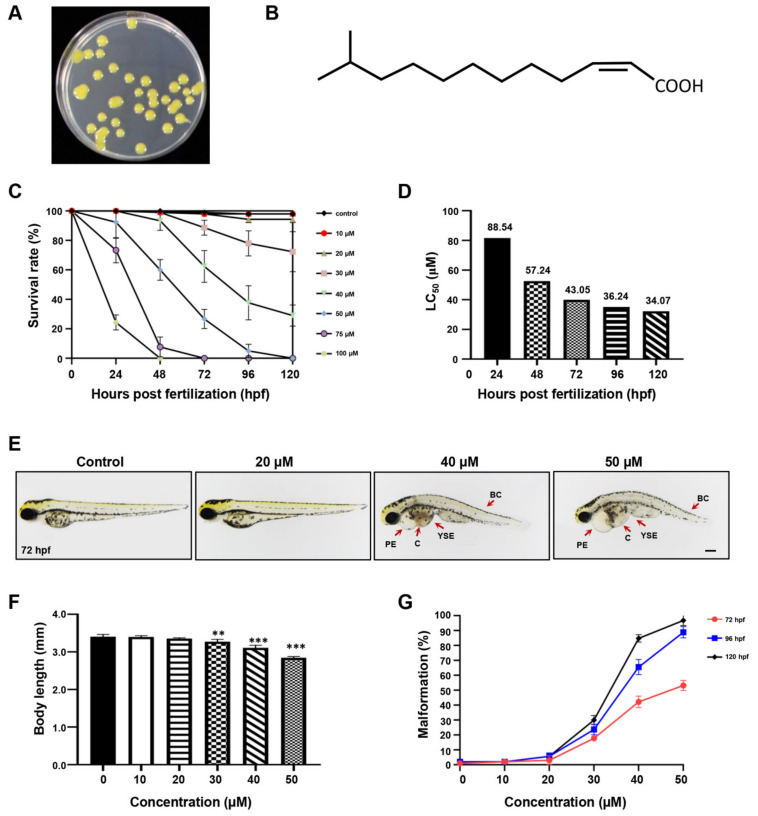
The effect of DSF on zebrafish embryos. (A) DSF producer Xcc. (B) The chemical structure of DSF. (C) The survival rate of embryos treated with different doses of DSF at 24, 48, 72, 96, and 120 hpf. (D) LC50 of DSF-treated embryos. (E) DSF-treated embryos (0, 20, 40, and 50 μM) revealed different malformed phenotypes at 72 hpf. PE, pericardial edema; YSE, yolk sac edema; C, congestion; BC, body curvature. (F) The body length was calculated at 72 hpf after embryos were treated with different doses of DSF. (G) Quantification of the malformation rate at 72, 96, and 120 hpf embryos after treatment with different doses of DSF. The LC50 was calculated with IBM SPSS 22 statistics. The values are represented as mean ± S.D. ** p < 0.01, *** p < 0.001. Scale bar, 200 μm.