
Image
|
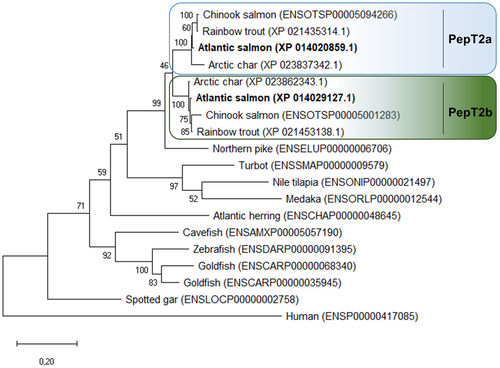
Figure Caption
Fig. 2 The (unrooted) phylogenetic tree was constructed based on deduced PepT2 amino acid sequences using the maximum likelihood method, 1000 bootstrap replicates, and Jones-Taylor-Thornton + G matrix-based model in MEGA X. The percentage of trees in which the associated taxa clustered together is shown next to the branches. Protein Acc. Nos. for GenBank or Ensembl databases are provided next to species common name. [Colour figure can be viewed at wileyonlinelibrary.com]
Acknowledgments
This image is the copyrighted work of the attributed author or publisher, and
ZFIN has permission only to display this image to its users.
Additional permissions should be obtained from the applicable author or publisher of the image.
Full text @ J. Physiol.