
Image
|
Figure Caption
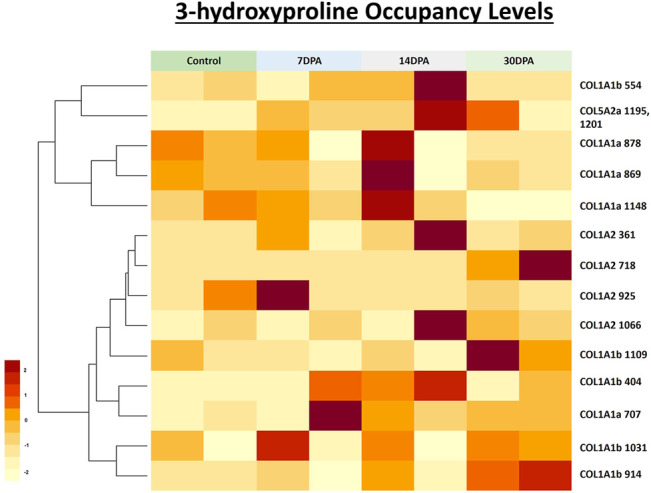
Fig. 7
Heatmap depicting the relative occupancy level of 3-hydroxyproline sites in three different chains of collagen 1 deposited in zebrafish heart ECM during regeneration. Further occupancy of one 3-HyP cluster of COL5A2a1195, 1201 was also quantitated during zebrafish heart regeneration. Normalized occupancy values of prolyl-3-hydroxylations were computed to generate the heat map. Light yellow represents the low value (lowest occupancy) and dark red shows the higher value (highest occupancy) in the row.
Acknowledgments
This image is the copyrighted work of the attributed author or publisher, and
ZFIN has permission only to display this image to its users.
Additional permissions should be obtained from the applicable author or publisher of the image.
Full text @ Front Mol Biosci