
|
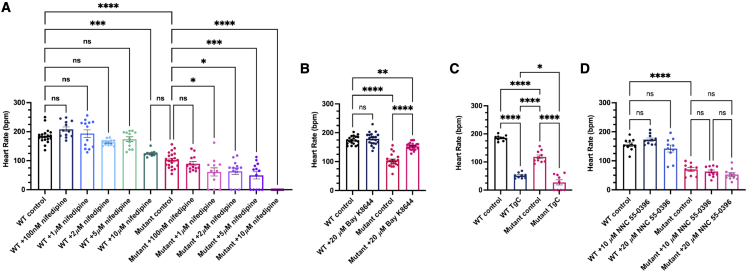
Fig. 5
Stx4 regulates L-type voltage gated Ca2+ channel activity
(A) Heart rates (HRs) determined from ventricular regions of interest of 72 hpf WT and stx4 mutant larvae following a dose-response treatment with 1% DMSO/embryo water (control), 100 nM nifedipine, 1 μM nifedipine, 2 μM nifedipine, 5 μM nifedipine, or 10 μM nifedipine for 45 min. Data are represented as the mean ± SEM, n = 10–21 larvae/group, one-way ANOVA, ∗p < 0.05, ∗∗∗p < 0.001, ∗∗∗∗p < 0.0001.
(B) HRs determined from 72 hpf WT and stx4 mutant larvae treated with either 1% DMSO/embryo water (control) or 20 μM Bay K-8644. Control stx4 mutants exhibit an ∼40% reduction in mean HR versus WT (WT control mean HR: 174.2 bpm, stx4 mutant control mean HR: 104.1 bpm). By contrast, stx4 mutants treated with 20 μM Bay K-8644 (mean HR: 153.1 bpm) are rescued to ∼90% of the WT control HR and ∼150% of the untreated stx4 mutant HR, while HR of WTs treated with 20 μM Bay K-8644 are similar to untreated WT controls (mean HR: 179.3 bpm). Data are represented as the mean ± SEM, n = 20–34 larvae/group, one-way ANOVA, ∗∗p < 0.01, ∗∗∗∗p < 0.0001.
(C) HRs determined from WT and stx4 mutant larvae treated with either 1% DMSO/embryo water (control) or a mixture of 10 μM thapsigargin and 10 mM caffeine (TgC). Data are represented as the mean ± SEM, n = 9–10 larvae/group, one-way ANOVA, ∗p < 0.05, ∗∗∗∗p < 0.0001.
(D) HRs determined from a dose-response of WT and stx4 mutant larvae treated with either 1% DMSO/embryo water (control), 10 μM NNC 55-0396, or 20 μM NNC 55-0396. Data are represented as the mean ± SEM, n = 10 larvae/group, one-way ANOVA, ∗∗∗∗p < 0.0001.