Fig. 3
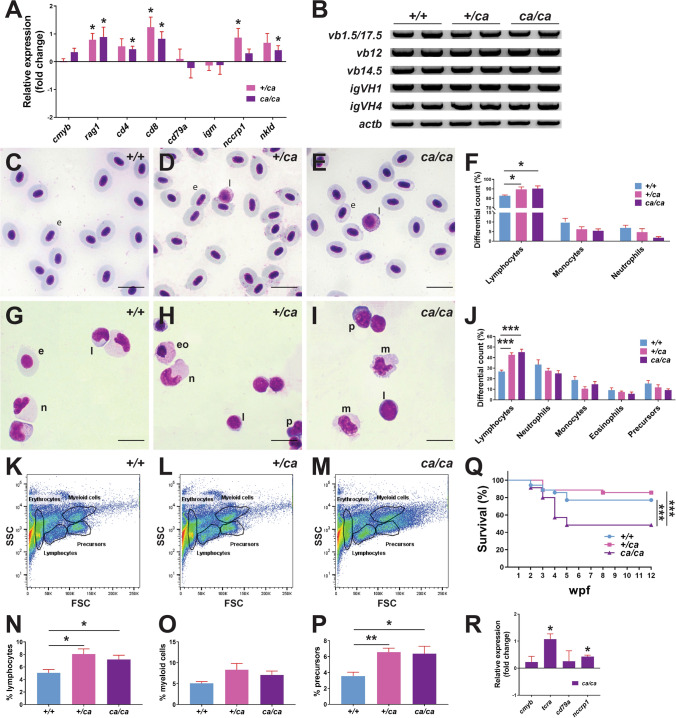
Effect of Jak3 A573V mutation on later hematopoiesis. A, B Gene expression analysis. Total RNA extracted from 28 dpf homozygous wild-type (jak3+/+), heterozygote (jak3+/ca) and homozygote (jak3ca/ca) mutant zebrafish was subjected to qRT2PCR analysis (A) with gene markers of hematopoietic stem cells (cmyb), T cells (rag1, cd4, cd8), B cells (cd79a, igm), and NK cells (nccrp1, nkld). Data are represented as relative fold change compared to homozygous wild-type (+/+) fish, with mean and SEM shown in red and statistical significance compared for Cq values normalized to control actb indicated (*p < 0.05; n = 3), or to RT-PCR (B) with primers specific for T cell receptor (TCR) β-chain (v(d)jcβ vb1.5, vb12, vb14.5) and B cell Ig heavy chain (igVH1, igVH4) rearrangements and actb as the control and analyzed by agarose gel electrophoresis. RT-negative controls yielded no products (data not shown) (n = 2). C–J Histological analysis. Giemsa stained blood cells (C–E) and kidney cells (G–I) of adult wild-type (jak3+/+) (C, G), heterozygote (jak3+/ca) (D, H) and homozygote (jak3ca/ca) (E, I) fish, with differential counts for blood (F) and kidney (J) performed (e: erythrocyte, eo: eosinophil, l: lymphocyte, n: neutrophil, p: precursor, m: macrophage) (n = 4–8; 100 × magnification; scale bar = 10 μm). K–P FACS analysis. Kidney cells from adult wild-type (jak3+/+) (K), heterozygote (jak3+/ca) (L) and homozygote (jak3ca/ca) (M) were subjected to FACS analysis, with lymphoid (N) myeloid (O) and precursor (P) populations quantified, with mean and SEM shown in red and level of statistical significance indicated (*p < 0.05, **p < 0.01; n = 5). Q Survival analysis. Wild-type (jak3+/+), heterozygote (jak3+/ca) and homozygote (jak3ca/ca) zebrafish were assessed weekly for survival, which is displayed as a Kaplan–Meier plot with level of statistical significance indicated (***p < 0.001, n = 35). R Gene expression analysis. Total RNA extracted from adult homozygous wild-type (jak3+/+), heterozygote (jak3+/ca) and homozygote (jak3ca/ca) zebrafish was subjected to qRT2PCR analysis with gene markers of hematopoietic stem cells (cmyb), T cells (tcra), B cells (cd79a), and NK cells (nccrp1), as described for panel A

