Fig. 6
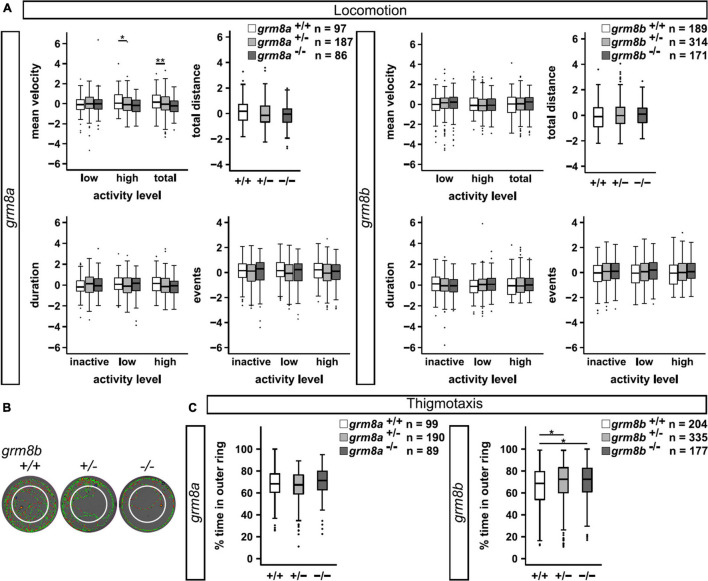
Behavioral characterization of grm8a and grm8b larvae. (A) Locomotor activity of grm8a (left panel) and grm8b mutant animals (right panel) were analyzed for mean velocity (top left) in low or high activity, or combined (total), total distance swum (top right), duration (bottom left) and events (bottom right) of inactivity, low and high activity. Raw data was standardized using z-score transformation. *P < 0.05, **P < 0.01. (B) Example traces of grm8b+/+, grm8b+/–, and grm8b–/– animals analyzed for thigmotaxis behavior. Note the reduced movement of mutant animals in the inner zone. Green represents slow, red fast movement. (C) Analysis of thigmotaxis behavior in grm8a (left panel) and grm8b (right panel) mutant animals. Time spent in the outer ring was analyzed for all genotypes and raw data standardized using z-score transformation. *P < 0.05.

