
Image
|
Figure Caption
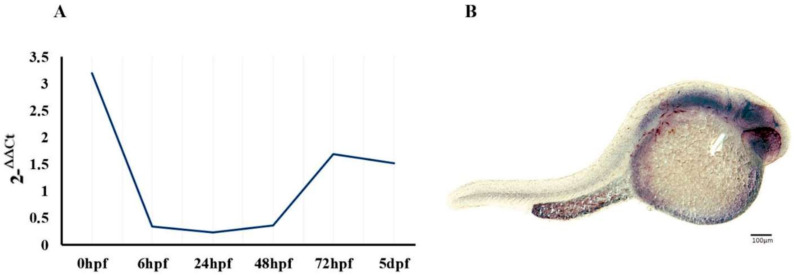
Fig. 1
Regional and developmental expression of the epm2a gene. (A) qRT−PCR analysis showing epm2a developmental relative expression from 0 hpf to 5 dpf in WT zebrafish. Three independent RNA samples (each obtained from about 30–40 larvae) for each stage. (B) Wholemount in situ hybridization showing epm2a regional expression in 24 hpf WT embryos.
Figure Data
Acknowledgments
This image is the copyrighted work of the attributed author or publisher, and
ZFIN has permission only to display this image to its users.
Additional permissions should be obtained from the applicable author or publisher of the image.
Full text @ Int. J. Mol. Sci.