
|
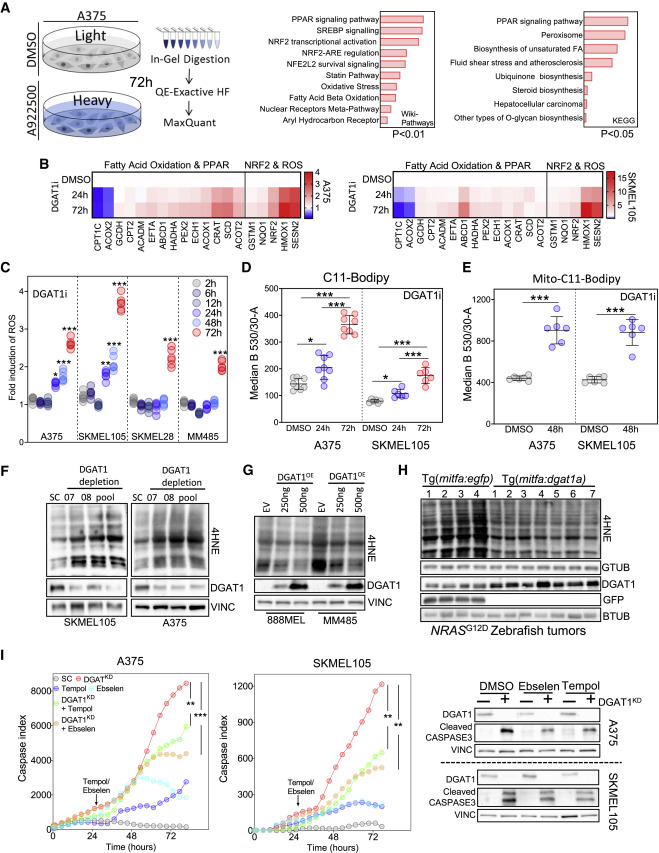
Fig. 5 Figure 5. DGAT1 promotes survival of melanoma cells through suppressing ROS generation (A) Total proteomics workflow (left). GEO of up-regulated proteins (114) ranked by combined score (wikipathways) or log-adjusted p values (metascape, right). (DMSO n = 3, A922500 n = 3). (B) RT-qPCR analysis following A922500 treatment. Fold change relative to DMSO (mean, n = 3). (C) ROS levels quantified using dihydroethidium (DHE) fluorescence following A922500 (DGAT1i) treatment. Fold change relative to DMSO (n > 4). (D) C11-Bodipy staining following A922500 treatment. Mean fluorescence determined using FACS (mean ± SD, n > 6). (E) Mito-C11-Bodipy staining following A922500 treatment. Mean fluorescence determined using FACS (mean ± SD, n > 6). (F) 4-Hydroxynonenal (4HNE) protein conjugate abundance and protein expression of DGAT1 following transfection with either DGAT1-targeting siRNA or a scrambled control for 48 h. (G) 4HNE protein conjugate abundance and protein expression of DGAT1 following transfection with either DGAT1 over-expression vector or an empty vector control for 48 h. (H) 4HNE protein conjugate abundance and protein expression of Dgat1 and GFP in NRASG12D-positive EGFP-expressing (n = 4) and NRASG12D-positive Dgat1a-over-expressing (n = 7) tumors. (I) Cleaved-caspase index following transfection of a DGAT1-targeting or scrambled siRNA. At 24 h, cells were treated with/without Tempol or Ebselen (mean, n = 3, outer). Corresponding protein expression of DGAT1 and cleaved caspase-3 (inner). (C–E and I) For significance: ∗p < 0.05, ∗∗p < 0.01, and ∗∗∗p < 0.001.