
Image
|
Figure Caption
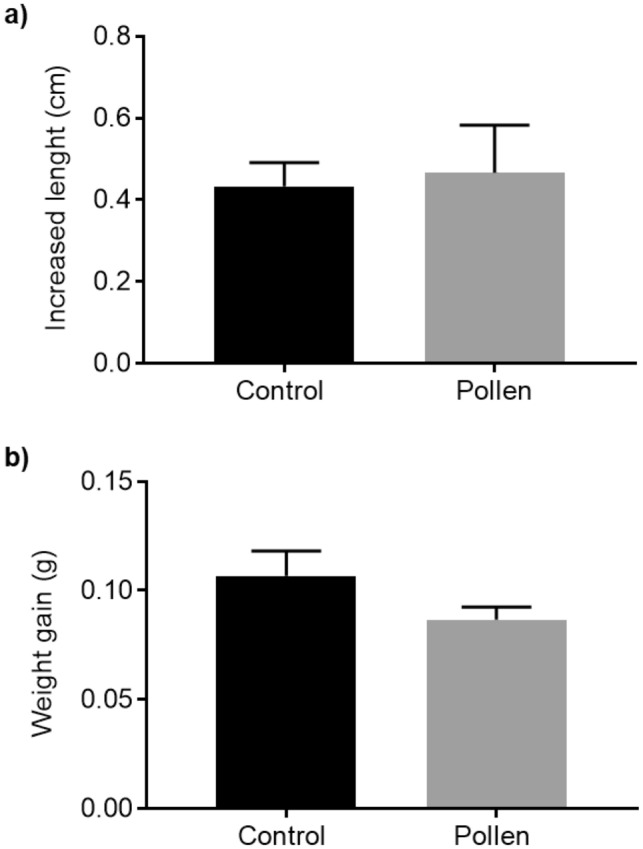
Fig. 1
Growth parameters of adult zebrafish after feeding with control diet (black bar) vs. pollen diet (gray bar). (a) Increased length (cm). (b) Mean weight gain (g). p > 0.05 according to unpaired Student t test. The data are shown as mean + SEM (n = 24).
Acknowledgments
This image is the copyrighted work of the attributed author or publisher, and
ZFIN has permission only to display this image to its users.
Additional permissions should be obtained from the applicable author or publisher of the image.
Full text @ Sci. Rep.