
Image
|
Figure Caption
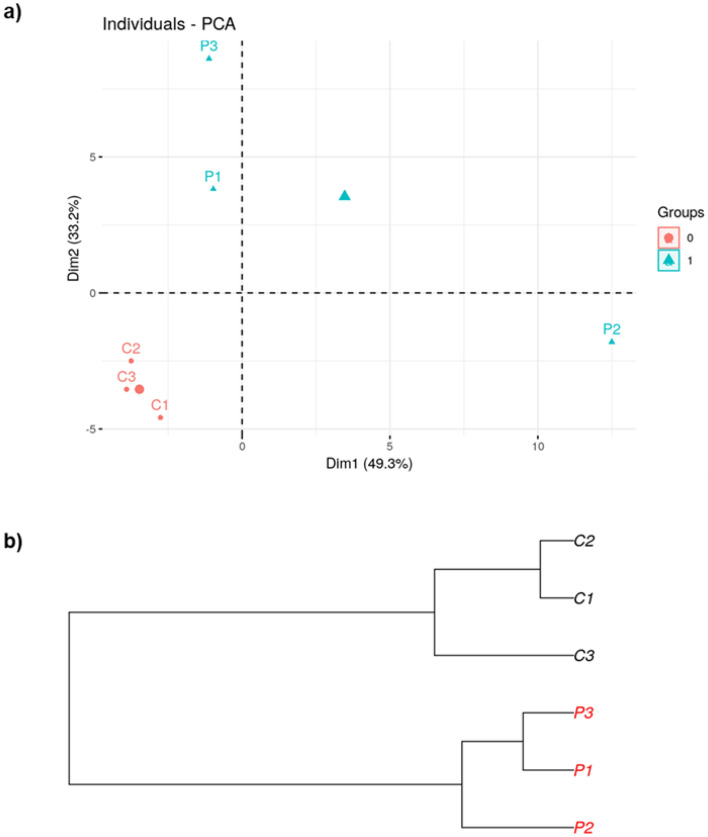
Fig. 2
Relationship between the composition of the gut bacterial communities in zebrafish fed with control diet (C1–3) and pollen supplemented diet (P1–3). (a) Principal Component Analysis (PCA) plot. (b) Dendrogram. Generated by R Core Team 2019.
Acknowledgments
This image is the copyrighted work of the attributed author or publisher, and
ZFIN has permission only to display this image to its users.
Additional permissions should be obtained from the applicable author or publisher of the image.
Full text @ Sci. Rep.