
|
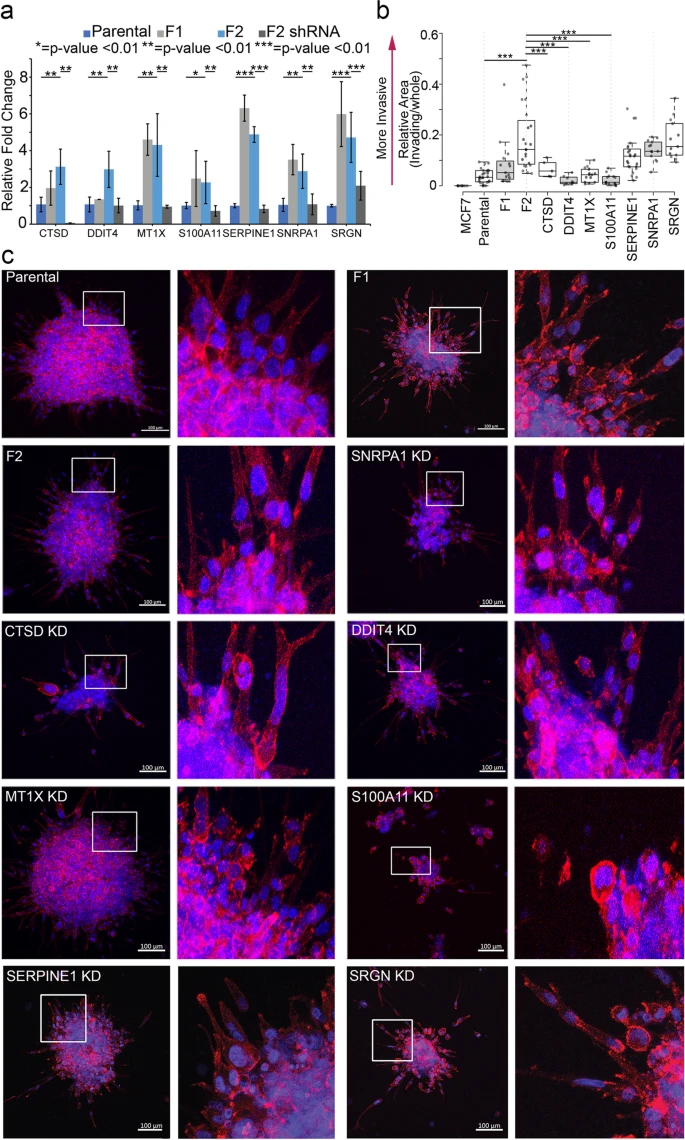
Fig. 4
Knock-down of DDIT4, MT1X, SERPINE1 and CTSD in MDA-MB-231 F2 cells revealed a role in breast cancer invasion. a qRT-PCR amplification quantifying knockdown of the respective gene within the MDA-MB-231 F2 population. Notably, expression of all genes was reduced to near parental expression levels. b After 24 hours, ECM embedded cell clusters of various knockdown and wildtype lines were quantified using ImageJ for invasion. Invasion is measured as relative area of cells that escape the cluster. c Representative immunofluorescence images (left panel of each pair) of embedded clusters stained for Hoechst (blue) and Phalloidin (red). Digitally zoomed insets taken from the full-sized image and highlighting invasion at the borders are provided (right panel of each pair). Insets correspond to dashed boxes on original scale image. Scale bars = 100 μm. * = p-value < .01; ** = p-value < .001; *** = p-value < .0001