
|
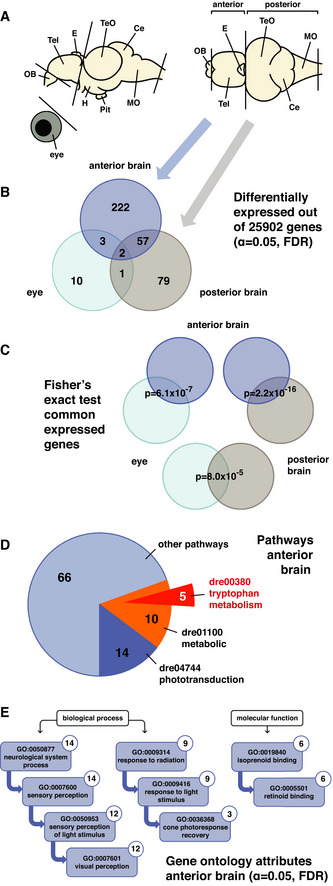
Figure 2 Expression profiling reveals pathways downstream of Opn4
A Representation of the zebrafish adult brain shows the lateral and dorsal view with abbreviations for the following domains: olfactory bulb [OB], telencephalon [Tel], epiphysis cerebri or pineal [E], optic tectum [TeO], cerebellum [Ce], medulla oblongata [MO], hypothalamus [H] and hypophysis or pituitary [Pit]. Transcriptome sequencing was performed on cDNA from wild‐type and
B Venn diagram shows the number of differentially expressed genes in the
C Fisher's exact test shows that the shared differentially expressed genes between data sets are unlikely to be the result of coincidence.
D Pie chart shows the number of differentially expressed genes in the
E Ancestor charts show the gene ontology attributes to which the differentially expressed genes in the