IMAGE

Fig. 9

ID
ZDB-IMAGE-220505-45
Source
Figures for Zimmermann et al., 2020
Image
Figure Caption

Fig. 9

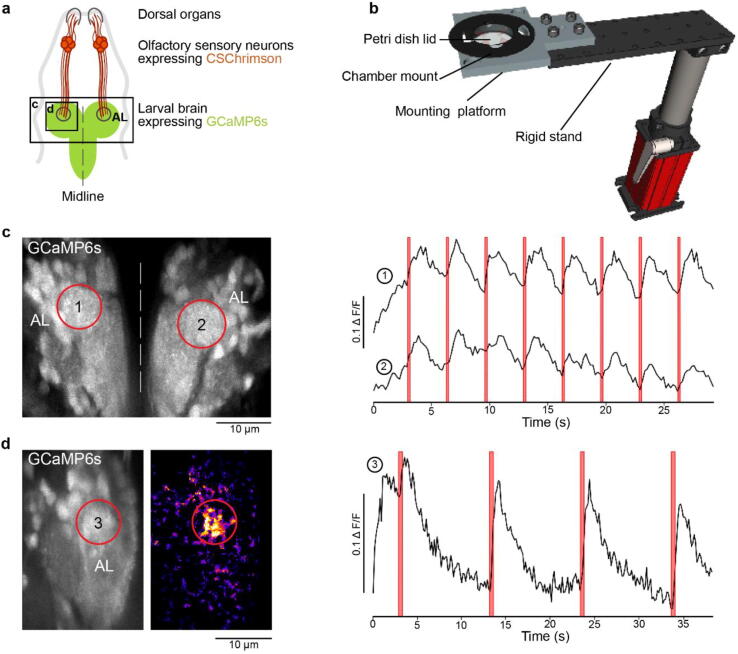
Drosophila optogenetics experiment. a. Schematic of a fruit fly first instar larval head expressing the red-shifted channel rhodopsin CsChrimson in olfactory sensory neurons and GCaMP6s in pan-neuronally. b. Rendering of the experimental setup: The mounting chamber (Fig. 6d) is placed in a 3D-printed holder (c.f. 3), screwed onto a rigid stand (ThorLabs). c-d. Standard deviation projections of 2 photon scan fields of the larval brain with antennal lobes marked by red circles (left) and Ca2+ traces in response to red flashes (right). c. Stimulation duration = 0.5 s, inter-stimulus interval = 3 s, image dimensions = 256 × 230, scan rate (lines) = 1,081 Hz, frame rate = 4.7 Hz. d. Stimulation duration = 0.5 s, inter-stimulus interval = 10 s, image dimensions = 256 × 170, scan rate (lines) = 1,077 Hz, frame rate = 6.34 Hz. Middle panel is a heatmap of pixel intensities showing high GCaMP6 fluorescence in the antennal lobe following optogenetic stimulation; obtained by subtracting a pre-stimulus from a during-stimulus image (median filter, kernel size = 2).

Acknowledgments
This image is the copyrighted work of the attributed author or publisher, and ZFIN has permission only to display this image to its users. Additional permissions should be obtained from the applicable author or publisher of the image. Full text @ HardwareX