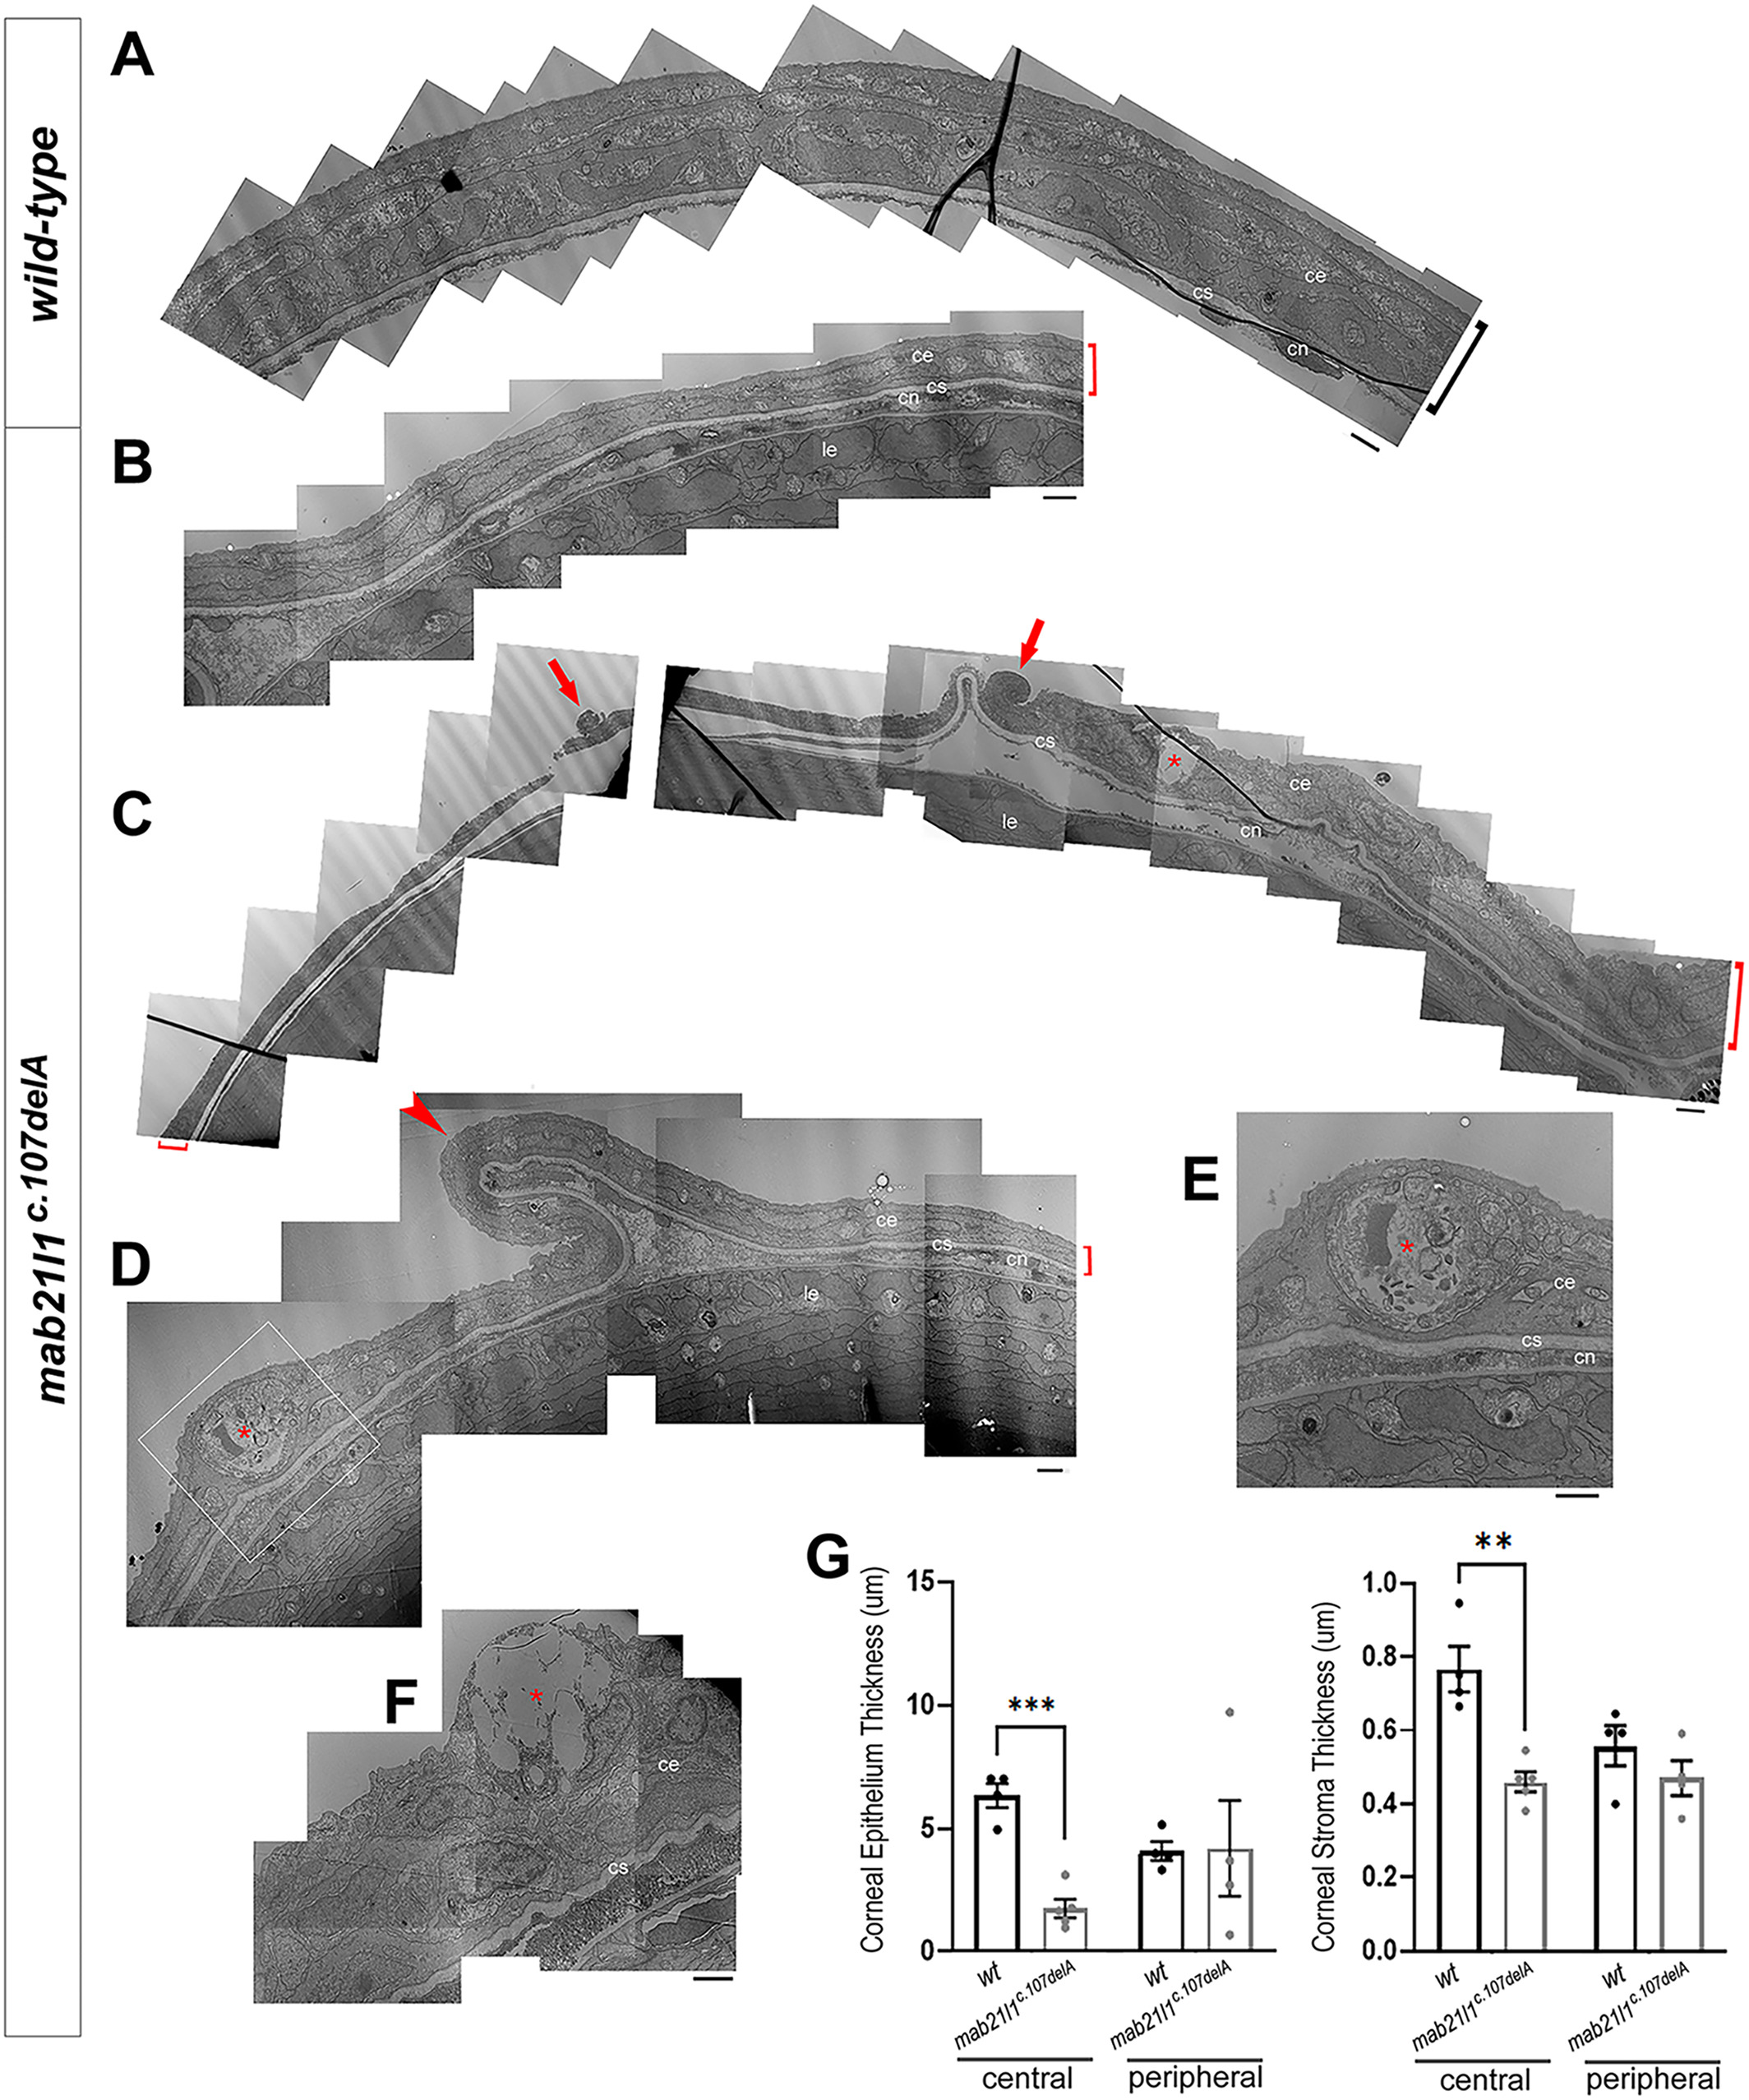
Fig. 5 Electron microscopy analysis of cornea. Electron microscopy data for 14-dpf wild-type, A, and mab21l1c.107delA mutant, B-F, corneas. Please note thinner (B,C,D; red brackets) and unevenly folded (D; red arrowhead) corneas, especially epithelial layer, in mutants vs wild-type, as well as the high number of abnormal cells (cells undergoing cell death [red arrows in, C], goblet [red asterisks in, C, F], and possible rodlet cells [red asterisks in D, E inset]); bar = 2 μM; (ce) corneal epithelium; (cs) corneal stroma; (cn) corneal endothelium; (le) lens epithelium. G, Measurements of corneal epithelial and stromal thickness for central and peripheral regions comparing wild-type and mab21l1c.107delA fish at 14-dpf based on EM images. Statistical significance is indicated by asterisks (central epithelium ***P = .00012; central stroma **P = .0018); error bars indicate SEM
Image
Figure Caption
Figure Data
Acknowledgments
This image is the copyrighted work of the attributed author or publisher, and
ZFIN has permission only to display this image to its users.
Additional permissions should be obtained from the applicable author or publisher of the image.
Full text @ Dev. Dyn.

