IMAGE

Fig 5

ID
ZDB-IMAGE-220331-40
Source
Figures for Reuter et al., 2022
Image
Figure Caption

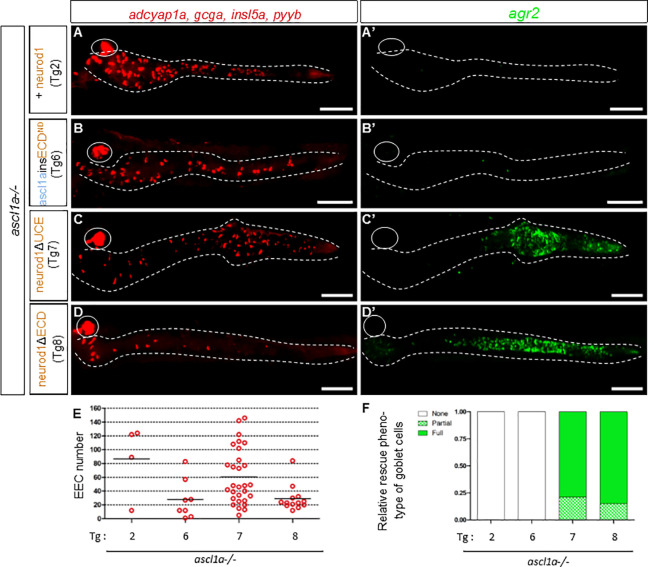
Fig 5 The ECD domain of Neurod1 represses goblet cell fate.

A-D: FISH performed at 96hpf with a mix of hormones probes (adcyap1a, gcga, insulin-like5a (insl5a) and pyyb) revealed in red and with the agr2 probe revealed in green (A’-D’) on ascl1a-/- transgenic embryos heat-shocked at 36, 46 and 56hpf. The transgenic line used is indicated on the left part of the figure. All views are ventral with the anterior part to the left and represent confocal projection images. The pancreas is encircled while the location of the gut, visualised with a DAPI staining (not shown), is delimited by dashed lines Scale bar: 100 μm. E: Number of EEC rescued cells in the gut when inducing the different transgenes (Tg2, Tg6 to Tg8) in ascl1a-/- larvae F: Percentage of larvae showing no, partial or full rescue of goblet cells when inducing the different transgenes (Tg2, Tg6 to Tg8) in ascl1a-/- larvae. The larvae expressing agr2 at a level similar to wt or higher were classified as “Full rescue” while larvae with lower expression of agr2 compared to wt were classified as “partial rescue”. Larvae without agr2 expression were classified as “no rescue”.

Acknowledgments
This image is the copyrighted work of the attributed author or publisher, and ZFIN has permission only to display this image to its users. Additional permissions should be obtained from the applicable author or publisher of the image. Full text @ PLoS Genet.