IMAGE

Figure 6—figure supplement 1.

ID
ZDB-IMAGE-220314-87
Source
Figures for Qi et al., 2022
Image
Figure Caption

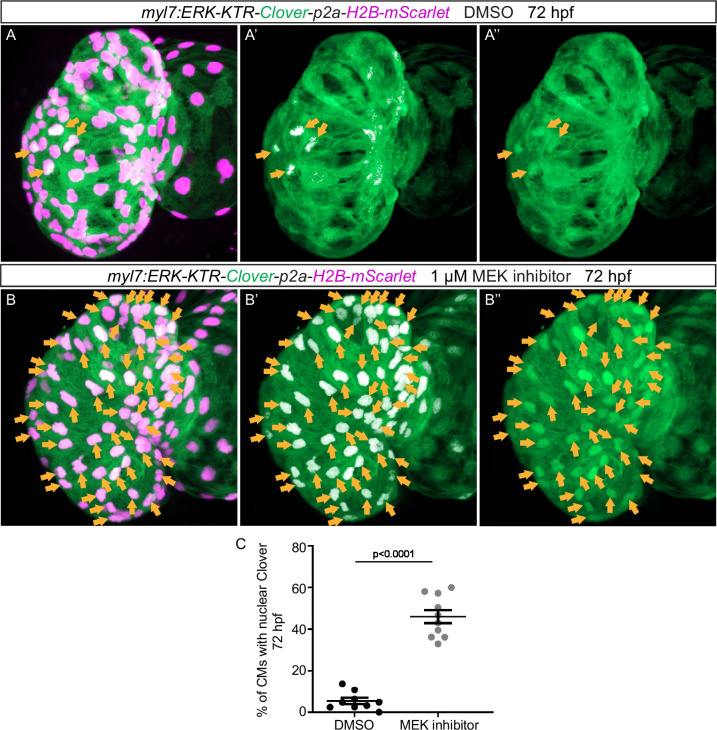
Figure 6—figure supplement 1. Validation of the extracellular signal-regulated kinase (Erk) reporter line using MEK inhibitor treatment.

(A–B) Confocal projection images. Maximum intensity projections of the heart of Tg(myl7:ERK-KTR-Clover-p2a-H2B-mScarlet) larvae at 72 hours post-fertilization (hpf). (B) Larvae treated with the MEK inhibitor PD 0325901 from 56 to 72 hpf exhibit an increased number of cardiomyocytes (CMs) with inactive Erk signaling (arrows) compared with larvae treated with DMSO (A). (C) Quantification of the percentage of ventricular CMs with nuclear Clover. All images are ventral views, anterior to the top. V, ventricle. Data in graphs expressed as mean ± SEM.

Acknowledgments
This image is the copyrighted work of the attributed author or publisher, and ZFIN has permission only to display this image to its users. Additional permissions should be obtained from the applicable author or publisher of the image. Full text @ Elife