
|
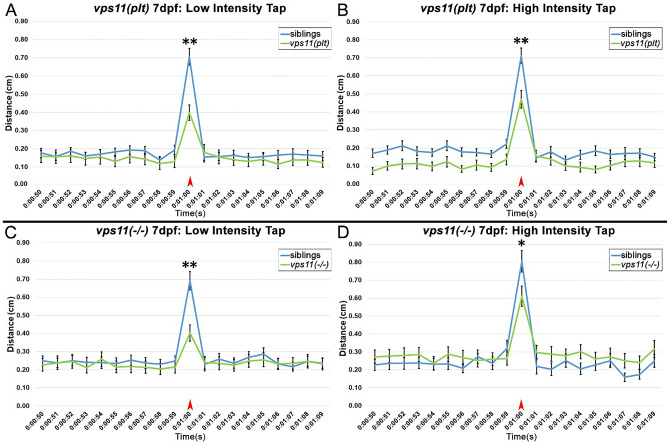
Figure 6
vps11(plt) and vps11(−/−) mutants at 7dpf show significantly reduced distance travelled in response to both low and high intensity acoustic/tap stimuli. (A–D) Line graphs representing distance travelled by larvae at 7dpf before and after an acoustic/tap stimulus (red arrow). (A) Response of vps11(plt) (green; n = 69) and sibling larvae (blue; n = 77) to a low intensity stimulus. (B) Response of vps11(plt) (green; n = 71) and sibling larvae (blue; n = 73) to a high intensity stimulus. (C) Response of vps11(−/−) (green; n = 54) and sibling larvae (blue; n = 54) to a low intensity stimulus. (D) Response of vps11(−/−) (green; n = 48) and sibling larvae (blue; n = 47) to a high intensity stimulus. *P < 0.05 **P < 0.01. Error bars indicate SEM.