
|
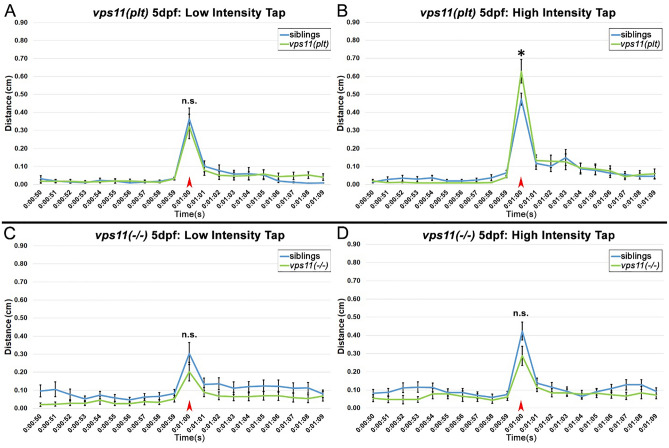
Figure 5
vps11(plt) and vps11(−/−) mutants at 5dpf show normal distance travelled in response to both low and high intensity acoustic/tap stimuli. (A–D) Line graphs representing distance travelled by larvae at 5dpf before and after an acoustic/tap stimulus (red arrow). (A) Response of vps11(plt) (green; n = 55) and sibling larvae (blue; n = 61) to a low intensity stimulus. (B) Response of vps11(plt) (green; n = 63) and sibling larvae (blue; n = 67) to a high intensity stimulus. (C) Response of vps11(−/−) (green; n = 59) and sibling larvae (blue; n = 60) to a low intensity stimulus. (D) Response of vps11(−/−) (green; n = 57) and sibling larvae (blue; n = 60) to a high intensity stimulus. Error bars indicate SEM.