
Image
|
Figure Caption
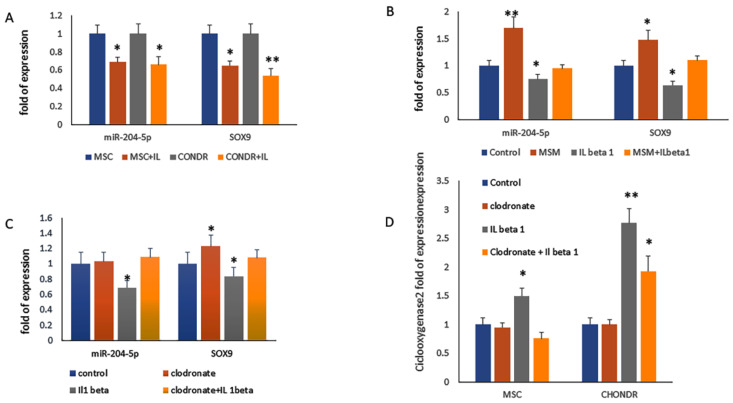
Figure 6
miR-204-5p and SOX9 mRNA expression levels quantified by RT-PCR in (A) MSCs during chondrogenesis (7 days post differentiation) and in chondrocytes after interleukin 1 beta (IL 1 beta), (B) methylsulphonylmethane (MSM) and (C) clodronate treatment. (D) Cyclooxygenase 2 mRNA expression levels quantified by RT-PCR in MSCs during chondrogenesis (7 days post differentiation) and in chondrocytes with and without IL 1 beta and clodronate treatment. (* p < 0.05; ** p < 0.005 vs. controls).
Acknowledgments
This image is the copyrighted work of the attributed author or publisher, and
ZFIN has permission only to display this image to its users.
Additional permissions should be obtained from the applicable author or publisher of the image.
Full text @ Int. J. Mol. Sci.