
Image
|
Figure Caption
Figure 1
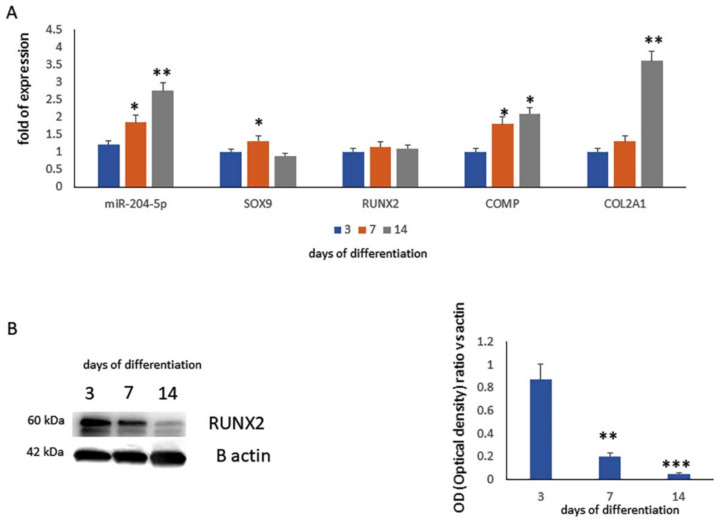
(A) MiR-204-5p and chondrogenic (SOX9, RUNX2, COMP, COL2A1) mRNA expression levels quantified by RT-PCR after 3, 7 and 14 days of chondrogenic differentiation in an MSCs in vitro model. RUNX2 protein expression levels assessed (B) by western blot analysis (left side) and quantified as a relative optical density ratio vs. B-actin (right side) on a protein lysate from an MSCs in vitro model after 3, 7 and 14 days of chondrogenic differentiation. (* p < 0.05; ** p < 0.005; *** p < 0.001 vs. expression levels of MSCs after 3 days of differentiation).
Acknowledgments
This image is the copyrighted work of the attributed author or publisher, and
ZFIN has permission only to display this image to its users.
Additional permissions should be obtained from the applicable author or publisher of the image.
Full text @ Int. J. Mol. Sci.