
|
Figure 4
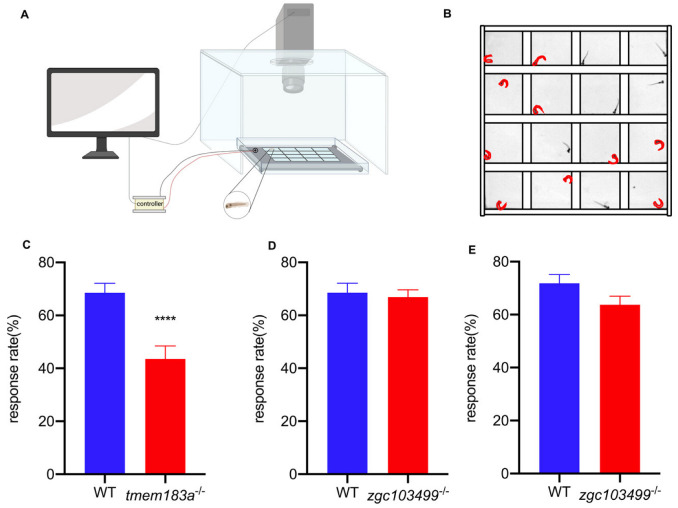
C-start response in tmem183a- and zgc103499-deficient zebrafish larva: (A) a diagram of the C-start experimental apparatus. A transparent plastic plate was placed on top of a light screen, which was vibrated by an oscillator. Each well was filled with 150 µL embryo medium and one zebrafish larva. The responses of 16 zebrafish were recorded in one session; (B) the representative frame of the C-start response in zebrafish; (C) the mean response rate of tmem183a-deficient zebrafish at 5 dpf. N(wild-type) = 48, N(tmem183a-/-) = 48, ****: p < 0.0001; (D) the mean response rate of zgc103499-/- zebrafish at 5 dpf. N(wild-type) = 48, N(zgc103499-/-) = 48, ns; (E) the mean response rate in zgc103499-/-zebrafish at 8 dpf. N(wild-type) = 48, N(zgc103499-/-) = 48, ns.