
|
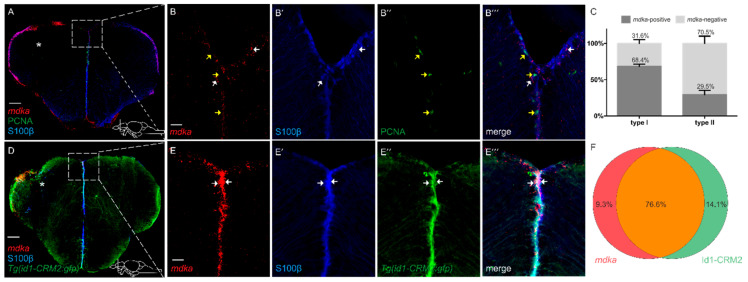
Figure 4
After injury, mdka is still highly expressed in S100β+/PCNA− type I cells. (A–B‴) FISH against mdka mRNA (red) combined with IF using antibodies against S100β (blue) and PCNA (green) on telencephalic cross-sections at 5 dpl. After injury, mdka mRNA is highly co-expressed with S100β and not detected in cells which are positive for PCNA. Boxed-in area in (A) represents area of magnification in (B–B‴). White arrows point to mdka+/S100β+ cells. Yellow arrows show mdka−/PCNA+ cells. (C) Quantification of S100β+, PCNA− type I and S100β+, PCNA+ type II cells expressing mdka mRNA after injury. (D–E‴) FISH against mdka mRNA (red) combined with IF using antibodies against S100β (blue) and GFP (green) on brains of the Tg(id1-CRM2:gfp) transgenic line at 5 dpl. The signal for mdka mRNA is strongly co-localized with cells positive for the transgene. Boxed-in area in (D) represents area of magnification in (E–E‴). White arrows indicate mdka+/S100β+/id1+ cells. (F) Quantification of cells expressing mdka mRNA in the Tg(id1-CRM2:gfp) transgenic line at 5 dpl. The injured hemisphere is indicated with an asterisk. Scale bar = 100 µm (A,D), 20 µm (B–B‴,E–E‴). Location of cross-sections is indicated in (A,D), respectively. n = 9 sections for quantifications.