
Image
|
Figure Caption
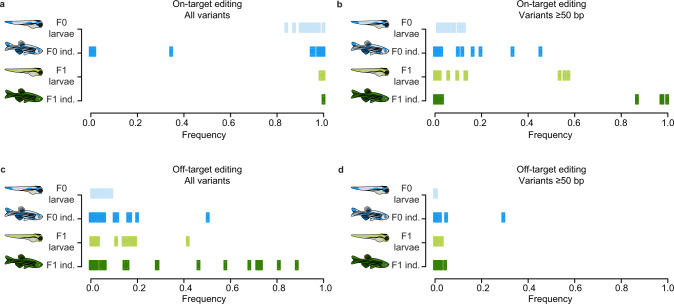
Fig. 6 The frequencies of Cas9-induced variants in all analyzed samples for the F0 and F1 generations are displayed in the summary plots (a–d). Each point represents one sample (i.e., a pool of larvae or an individual juvenile/adult fish). a The total frequencies of Cas9-induced variants at on-target sites. b The frequencies of SVs induced by Cas9 at on-target sites. c The total frequencies of Cas9-induced variants at off-target sites (sh2b3 off-target 1, ywhaqa off-targets 1 and 2). d The frequencies of SVs induced by Cas9 at off-target sites. Source data are provided as a Source Data file.
Acknowledgments
This image is the copyrighted work of the attributed author or publisher, and
ZFIN has permission only to display this image to its users.
Additional permissions should be obtained from the applicable author or publisher of the image.
Full text @ Nat. Commun.