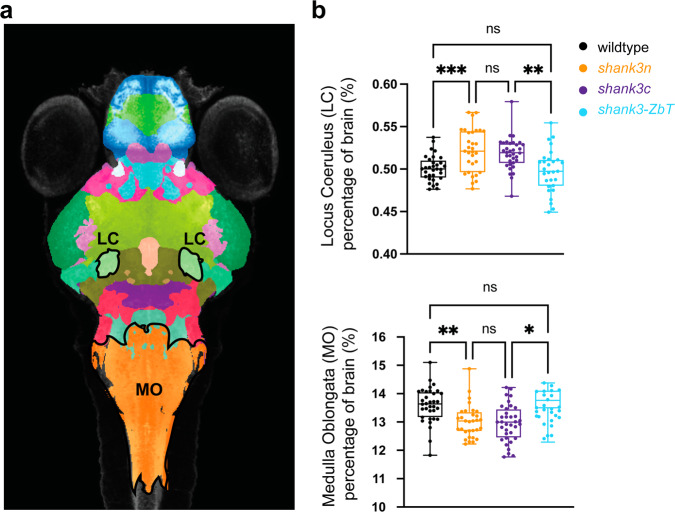
Fig. 4 a z-stack image from CobraZ reference and 26 segment atlas. Regions outlined in black denote the locus coeruleus (LC) and medulla oblongata (MO). Scale bar = 100 µm. b Box plots comparing relative volume of LC and MO brain segments in wild-type, shank3abΔn and shank3abΔc mutants, and shank3ab mutants with wild-type transplanted brain stems (shank3abΔZb-T). Exact sample sizes of biologically independent samples for each condition and genotype (n = lights-on/lights-off); wild-type (n = 16/19), shank3abΔN (n = 19/21) and shank3abΔC (n = 16/15). Boxes denote the median, 1st and 3rd quartile, while whiskers represent the minimum and maximum values. Brain segment sizes were analyzed using a non-parametric Kruskal–Wallis one-way ANOVA and followed by a Dunn’s corrected multiple values comparison. P-value asterisks represent; p < 0.05 - *, p < 0.01 - **, p < 0.001 - ***, p < 0.0001-****. Source data for plots are provided in Supplementary Data 2.
Image
Figure Caption
Acknowledgments
This image is the copyrighted work of the attributed author or publisher, and
ZFIN has permission only to display this image to its users.
Additional permissions should be obtained from the applicable author or publisher of the image.
Full text @ Commun Biol

