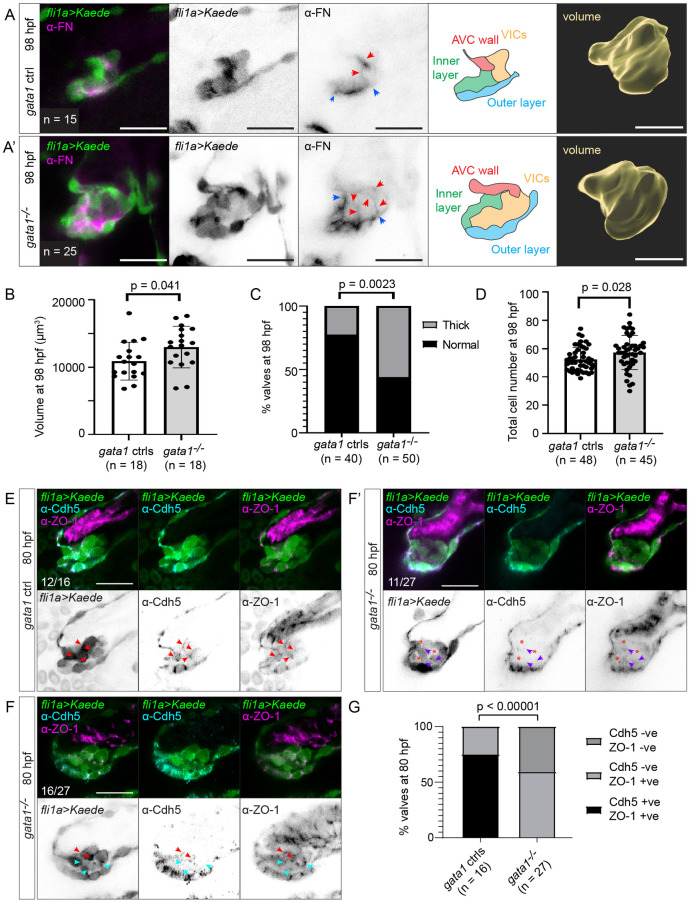
Fig 6
(A) Gata1 controls and gata1 mutants in the Tg(fli1a:gal4ff;UAS:Kaede) background were analyzed at 98 hpf. Some of these were stained for FN (first to third column). Both control and mutant valves show FN immunoreactivity basal to the luminal layer of valve endocardial cells (between blue arrows), as well as around abluminal cells (red arrows). Schematics in the fourth column show how we demarcate different valve regions at 98 hpf. Fifth column shows 3D rendering of valve surface (inner layer, outer layer, and VICs). Scale bars: 20 μm. (B) Graph showing volume of valves at 98 hpf. p-Value: Welch t test. (C) Graph showing percentage of valves at 98 hpf that appear thick based on fixed embryos. p-Value: Fisher exact test. (D) Total number of cells in the valve region at 98 hpf (AVC wall, inner layer, outer layer, and VICs). p-Value: Welch t test. (E) Gata1 controls immunostained for VE-cadherin and ZO-1 at 80 hpf. In 12/16 embryos, valve cells were immunopositive for both VE-cadherin and ZO-1 (red arrows). (F–F’) Gata1 mutants immunostained for VE-cadherin and ZO-1 at 80 hpf. (F) In 16/27 embryos, some abluminal cells appear to have reexpressed VE-cadherin normally (red arrows), while others are immunopositive for ZO-1 but fail to reexpress VE-cadherin (cyan arrows). (F’) In 11/27 embryos, there is only residual ZO-1 signal in abluminal cells (purple arrows). In regions where ZO-1 signal is absent, gaps are formed between cells (red asterisks). (G) Graph showing quantification of Cdh5 and ZO-1 staining. p-Values are calculated using Fisher exact test for normal expression Cdd5 and ZO-1 expression pattern (Cdh5 +ve, ZO-1 +ve) versus abnormal expression Cdd5 and ZO-1 pattern (Cdh5 –ve, ZO-1 –ve; Cdh5 –ve, ZO-1 –ve). Scale bars: 20 μm. AVC, atrioventricular canal; FN, fibronectin; hpf, hours postfertilization; VIC, valve interstitial cell; ZO-1, zonula occludens-1.

