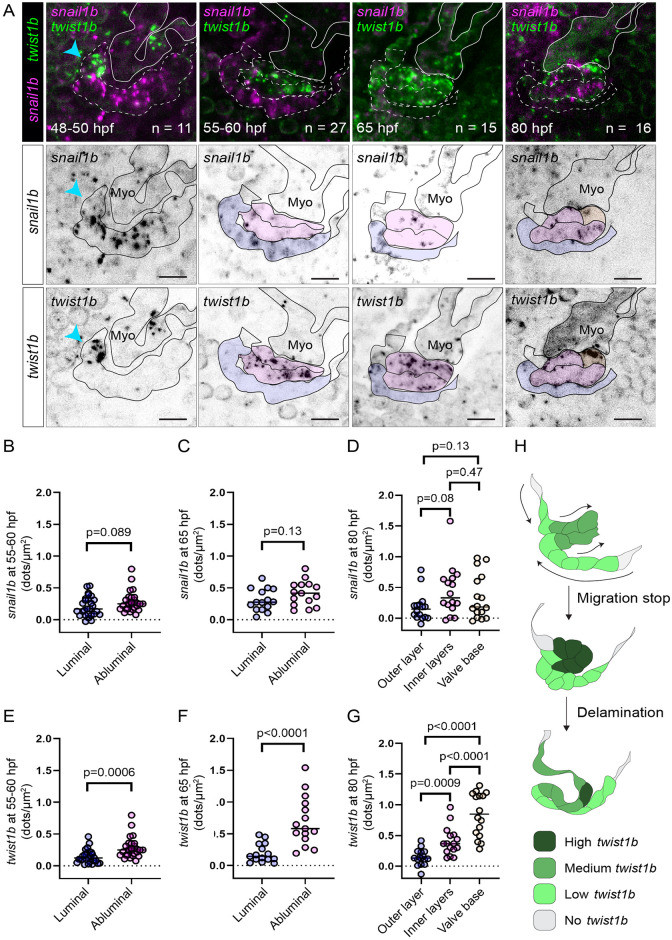
Fig 5
(A) Representative images of developing superior AV valves between 48 and 80 hpf that have been stained using snail1b and twist1b probes. The top row shows images where channels for snail1b (magenta) and twist1b (green) expression are shown simultaneously. The second and third rows show snail1b and twist1b signal, respectively, with our interpretation of valve morphology superimposed on the images. (B–D) and (E–G) are dot plots showing the number of detected dots, each corresponding to 1 snail1b (B–D) or 1 twist1b (E–G) mRNA molecule, calculated for different valve regions at 55 to 60, 65, and 80 hpf. The color of the dots corresponds to the regions shown in (A) and indicates where the measurement was performed. p-Values were determined using unpaired t test in (B, C, E, F) and using 1-way ANOVA in (D,G). (H) Suggested model showing the dynamics of twist1b expression. Scale bars: 10 μm. AV, atrioventricular valve; hpf, hours postfertilization.

