
Image
|
Figure Caption
Figure 7
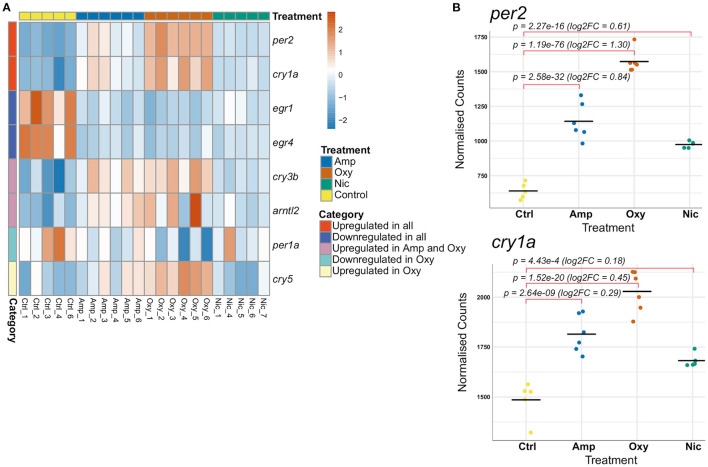
Developmental drug exposures lead to differential expression of circadian regulators. (A) Heatmap showing expression levels of significantly differentially expressed genes involved in the regulation of circadian rhythm across treatments. Each row/gene of the heatmap has been centered and scaled (mean = 0, standard deviation = 1). (B) Plots of normalized counts for the genes per2 and cry1a, which are significantly upregulated in all treatments.
Acknowledgments
This image is the copyrighted work of the attributed author or publisher, and
ZFIN has permission only to display this image to its users.
Additional permissions should be obtained from the applicable author or publisher of the image.
Full text @ Front Psychiatry