
|
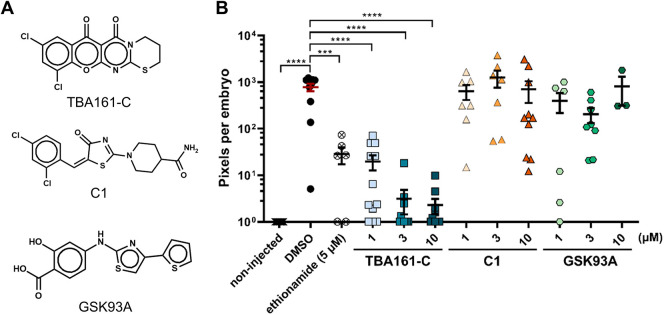
Fig. 5.
TBA161-C has potent activity in the zebrafish infection model compared to other AspS inhibitors. (A) The chemical structures of the test compounds, TBA161-C, C1 and GSK93A. (B) Zebrafish embryos were yolk infected with M. marinum-tdTomato and treated with compounds at the indicated concentrations. Each data point represents the integrated red fluorescence intensity of a single zebrafish embryo, and the signal of each group is expressed as mean±s.e.m. Statistical significance was determined by one-way ANOVA, following Dunnett's multiple comparison test by comparing the signal from the DMSO-treated control sample with each treatment group (***P≤0.001, ****P≤0.0001).