
|
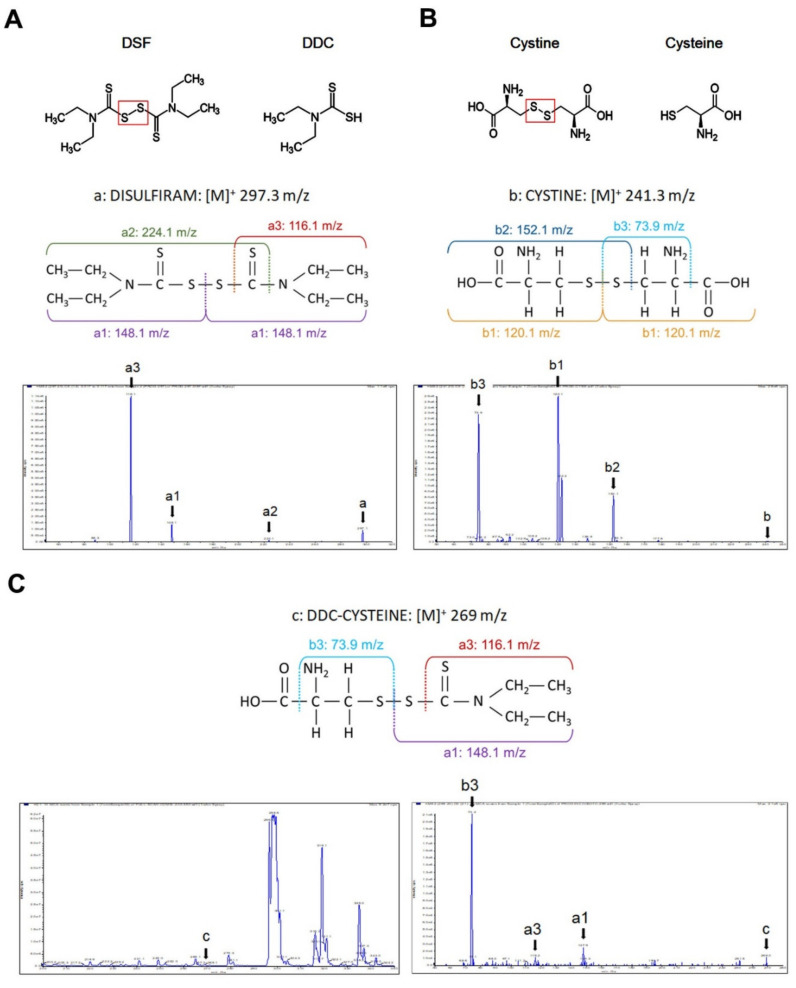
Figure 1 MS/MS determination of DSF, cystine and mixed-disulfides. (A) Chemical structures of DSF and diethyldithiocarbamate (DDC). The chromatogram shows peaks corresponding to DSF (a), half molecule of DSF (a1) and two molecules obtained by breaking the carbon-sulfur bond (a2 and a3). (B) Chemical structures of cystine and cysteine. The chromatogram shows peaks corresponding to cystine (b), half molecule of cystine (b1), and fragments obtained after breaking carbon-sulfur (b2) and carbon–carbon bonds (b3). (C) Mixed disulfides. The chromatogram on the left panel shows a peak indicating the formation of a mixed-disulfide with a calculated mass–charge ratio (m/z) of 269 (c). The right panel shows the product ion scan for the 269 m/z peak, identifying three fragments: the 148 m/z peak corresponds to half molecules of DSF (a1), the 116 m/z peak is produced by thiol-ester bond cleavage of DSF (a3), and the 74 m/z peak corresponds to cystine (b3).