
|
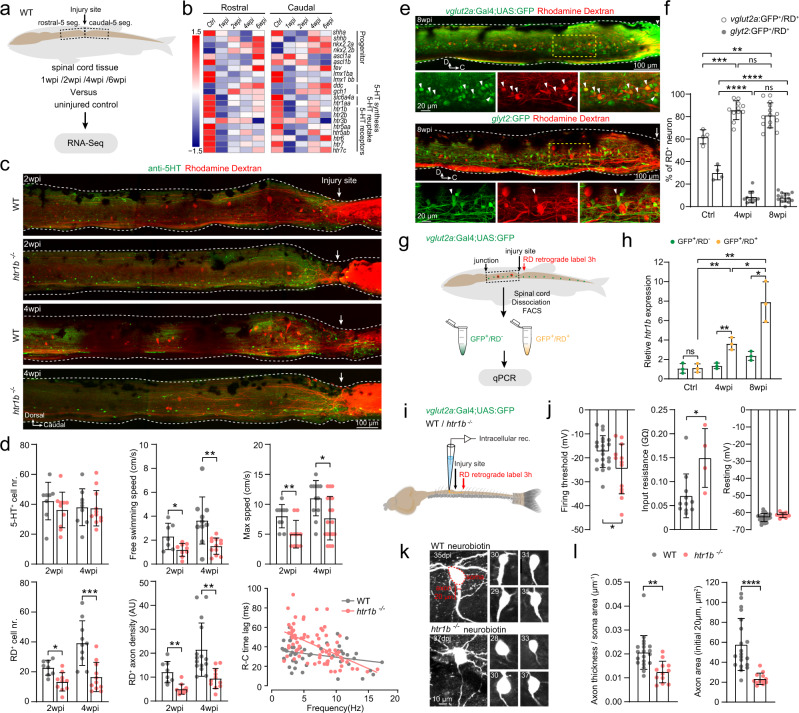
Fig. 4
a Collection of five spinal segments rostral or caudal to the injury site from wild-type (WT) SCI fish and corresponding segments from uninjured fish (n = 3 fish for each group) for RNA-seq (N = 4–5 libraries in each group). b Heatmap of mean FPKM values showing differentially expressed serotonin related genes after SCI. Differential expression analysis was performed between two groups (Ctrl versus 1-/2-/4-/6 wpi) using the DESeq2 (adjusted P-value < 0.05 after Benjamini and Hochberg’s approach). c Immunohistochemistry images show the distribution of 5-HT+ ISNs and RD+ retrogradely labeled axon-regrown spinal interneurons in WT and htr1b−/− SCI fish. d Quantification of WT (gray dots) and htr1b−/− (red dots) SCI fish ISNs numbers in the region of 500 μm covering the injury site; free swimming speed; maximum speed; axon-regrown spinal interneuron numbers; regrown axon density and EMG recording of R–C time lag versus swimming frequency. e Immunohistochemistry images show the RD+ retrogradely labeled axon-regrown spinal interneurons in Tg(vglut2a:Gal4;UAS:GFP) (upper) and Tg(glyt2:GFP) (lower) SCI fish. Expanded images of yellow dash-line boxes show RD co-labeling with vlgut2a:GFP or glyt2:GFP (arrowheads) indicating axon-regrown excitatory or inhibitory interneurons. f Number of axon-regrown excitatory and inhibitory interneurons expressed as a percentage of RD+ neuron numbers after SCI, and comparison with the proportions of uninjured fish. g, h FAC-sorting of axon-regrown excitatory interneurons (vglut2a:GFP+/RD+) and non-labeled excitatory interneurons (vglut2a:GFP+/RD−) from uninjured and SCI fish (g) for detection of relative htr1b expression (h). i Illustration of the in vitro spinal cord preparation for whole-cell patch-clamp recording. j Mean data of electrophysiological properties of axon-regrown excitatory interneurons in SCI fish with WT and htr1b−/− background. k Morphology of recorded axon-regrown excitatory interneurons filled with neurobiotin. Soma size (red dashed lines), the initial 20 μm length and thickness of axon (red line) are highlighted in top left image and used for morphology analysis. l Quantification of axon size of recorded axon-regrown excitatory interneurons. All data are presented as mean ± SD. *P < 0.05, **P < 0.01, ***P < 0.001, ****P < 0.0001, significant difference. For detailed statistics, see Supplementary Table 1.