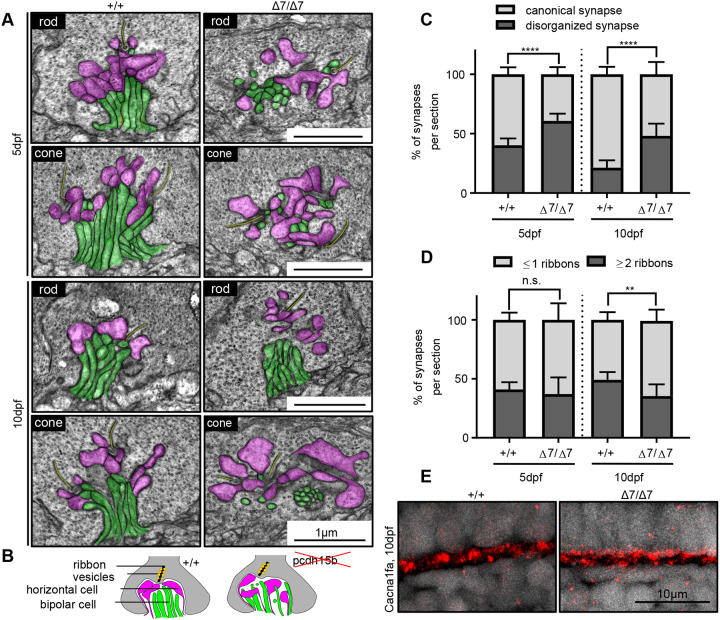
Fig. 8.
Photoreceptor ribbon synapses show increased disorganization in pcdh15b mutants. (A) Representative TEM images of photoreceptor ribbon synapses from both rod and cone terminals in wild-type siblings and pcdh15b Δ7 mutants at 5 dpf and 10 dpf. Bipolar cell innervations (green) and horizontal cell innervations (pink) into photoreceptor termini and ribbon synapses (yellow) are highlighted. (B) Schematic of synaptic structure in wild-type and pcdh15b mutants. Magenta, horizontal cell processes; green, bipolar cell processes. Ribbons are shown as a black line, surrounded by yellow-coloured vesicles. (C) Quantification of the percentage of synapses that display a canonical or disorganized synapse organization in wild-type siblings and Δ7 mutants at 5 dpf and 10 dpf. (D) Quantification of the percentage of synapses that contain one or less ribbons (usually associated with rod termini), or two or more ribbons (usually associated with cone termini), in wild-type siblings and Δ7 mutants at 5 dpf and 10 dpf. (E) Representative images of calcium channel 1.4v staining (Cacna1fa) in the outer plexiform layer, at photoreceptor termini (n=5+ individuals for each genotype). Statistical analyses in C and D were performed using Student’s t-tests (unpaired, two-tailed). n.s., not significant; **P≤0.01, ****P≤0.0001. Number of eyes/synapses analysed: 5 dpf: +/+, 10 eyes/620 synapses; Δ7/Δ7, 10 eyes/593 synapses; 10 dpf: +/+, 8 eyes/201 synapses; Δ7/Δ7, 8 eyes/192 synapses. Synapses used in quantification were sampled from the central ONL.

