Figure 4
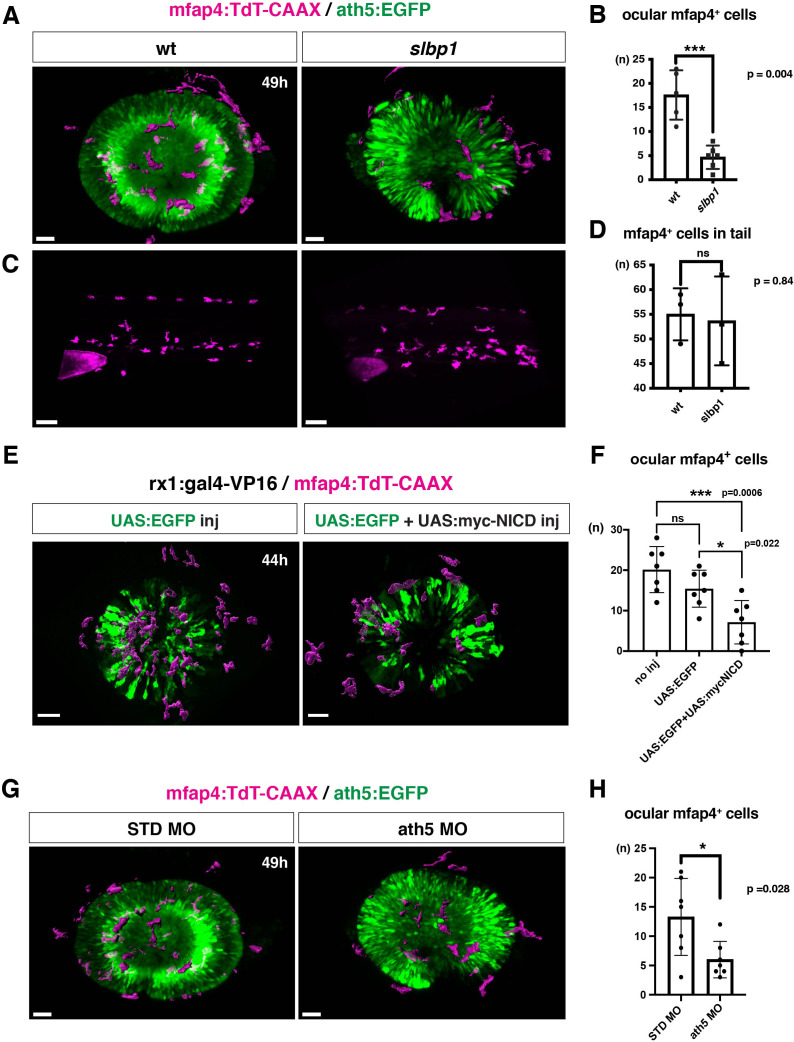
(A) Live 3D images of wild-type and slbp1 mutant retinas with Tg[mfap4:tdTomato-CAAX; ath5:EGFP] at 49 hpf. Only mfap4:tdTomato-CAAX-positive ocular microglial precursors and peripheral macrophages are shown as surface-rendered objects. Original images are shown in Figure 4—figure supplement 2A. Scale bar: 30 μm. (B) Histogram of numbers of ocular microglial precursors in slbp1 mutants and wild-type siblings. mfap4-positive microglial precursors are significantly fewer in slbp1 mutants. Bars and lines indicate means ± SD. ***p < 0.001. (C) Live 3D images of wild-type and slbp1 mutant trunk with Tg[mfap4:tdTomato-CAAX; ath5:EGFP] at 49 hpf. Scale bar: 70 μm. (D) Histogram of numbers of trunk macrophages in slbp1 mutants and wild-type siblings. There is no significant difference in mfap4-positive macrophage number in trunks of slbp1 mutants. Bars and lines indicate means ± SD. (E) Live 3D images of retinas of Tg[rx1:gal4-VP16; mfap4:tdTomato-CAAX] embryos injected with one DNA construct encoding UAS:EGFP (left) or two DNA constructs encoding UAS:EGFP; UAS:myc-tagged NICD (right) at 44 hpf. Only mfap4:tdTomato-CAAX-positive ocular microglial precursors and peripheral macrophages are shown as surface-rendered objects. Original images are shown in Figure 4—figure supplement 2B. Scale bar: 30 μm. (F) Histogram of numbers of ocular microglial precursors in rx1:gal4-VP16; UAS:EGFP expressed and rx1:gal4-VP16; UAS:EGFP; UAS:myc-NICD expressed wild-type retinas. mfap4-positive microglia are significantly decreased in myc-NICD expressed retinas, compared with non-injection control and EGFP expressed control retinas. Bars and lines indicate means ± SD. *P < 0.05, ***P < 0.001. (G) Live 3D images of standard MO- and ath5 MO-injected retinas of Tg[mfap4:tdTomato-CAAX; ath5:EGFP] embryos at 49 hpf. Only mfap4:tdTomato-CAAX-positive ocular microglial precursors and peripheral macrophages are shown as surface-rendered objects. Original images are shown in Figure 4—figure supplement 2C. Scale bar: 30 μm. (H) Histogram of numbers of ocular microglial precursors in standard MO and ath5 MO-injected wild-type retinas. mfap4-positive microglial precursors are significantly less numerous in ath5 morphant retinas. Bars and lines indicate means ± SD. *p < 0.05.
Microglial precursor infiltration into the retina depends on retinal neurogenesis.
Image
Figure Caption
Acknowledgments
This image is the copyrighted work of the attributed author or publisher, and
ZFIN has permission only to display this image to its users.
Additional permissions should be obtained from the applicable author or publisher of the image.
Full text @ Elife

