Figure 3
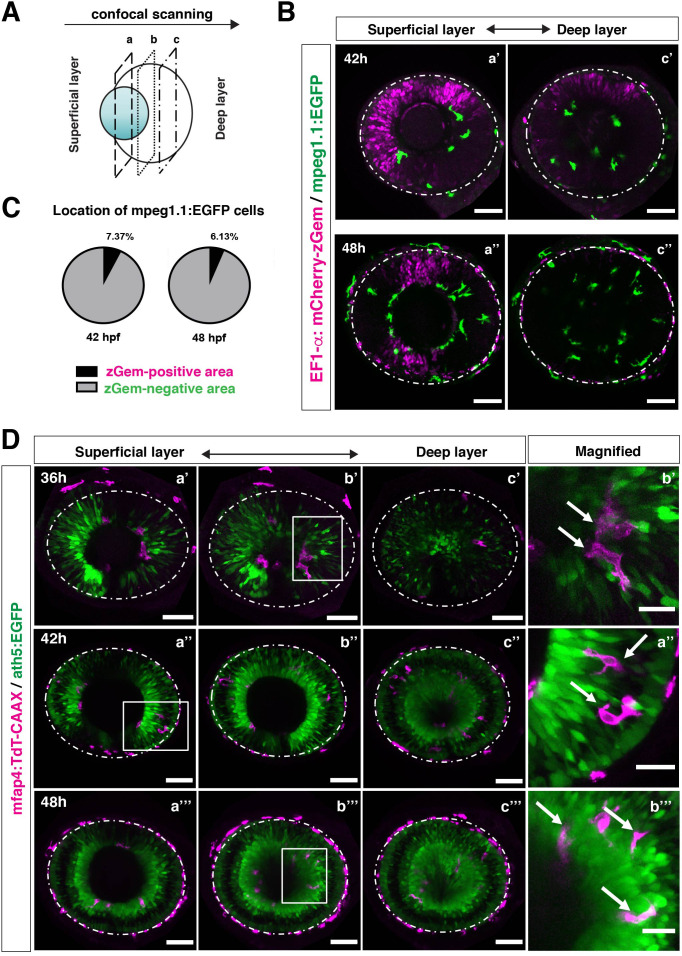
(A) Schematic drawing of confocal scanning planes (superficial, middle, and deep layers) in the optic cup shown in (B) and (D). (B) Live images of Tg[EF1α:mCherry-zGem; mpeg1.1:EGFP] retinas at 42 hpf (upper panels) and 48 hpf (lower panels). Two levels of confocal scanning planes are indicated as superficial (a’, a’’) and deep positions (c’, c’’). mpeg1.1:EGFP positive microglial precursors avoid mCherry-zGem positive proliferating retinal cell area. Scale bar: 50 μm. (C) Histogram of the fraction of microglial precursors associated with the mCherry-zGem-positive area (black) and the mCherry-zGem-negative area (grey). The fraction of microglial precursors associated with the mCherry-zGem-positive area is only 7.37 % at 42 hpf and 6.13 % at 48 hpf. Thus, more than 90 % of microglial precursors are located in the mCherry-zGem-negative retinal area. (D) Live images of Tg[ath5:EGFP; mfap4:tdTomato-CAAX] retinas at 36 (upper panels), 42 (middle panels) and 48 hpf (bottom panels). Three confocal scanning plane levels are indicated as superficial (a’-a”’), middle (b’-b”’), and deep (c-c”’). Dotted circles indicate the outline of the optic cup. The right-most column images indicate higher magnification images shown in the square of left panels. mfap4-positive microglia (magenta, arrows) are closely associated with ath5-positive neurogenic cells (green). Scale bar: 50 μm, except the right-most column images (Scale bar: 15 μm).
Microglial precursors infiltrate the retina through the neurogenic area.
Image
Figure Caption
Acknowledgments
This image is the copyrighted work of the attributed author or publisher, and
ZFIN has permission only to display this image to its users.
Additional permissions should be obtained from the applicable author or publisher of the image.
Full text @ Elife

