IMAGE

Figure 10

ID
ZDB-IMAGE-211216-157
Source
Figures for Dalum et al., 2021
Image
Figure Caption

Figure 10

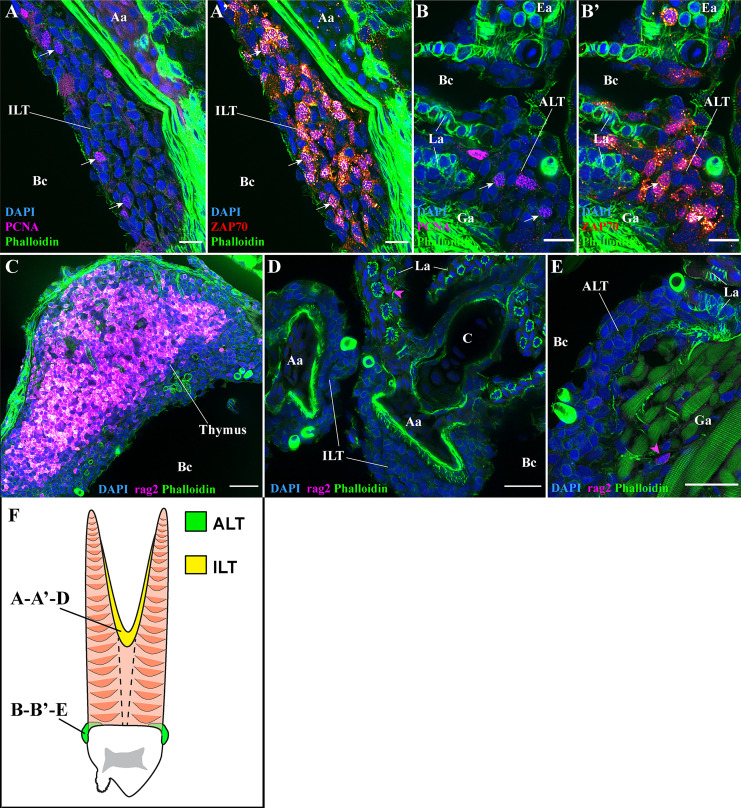
T/NK cell proliferation and RAG2 expression. Representative deconvolved confocal images of adult zebrafish gills displaying the ILT (A, A’, D), the ALT (B, B’, E), as illustrated on panel (F), and the thymus (C), at high-magnification. Images were acquired from 30 μm whole-body cryosections stained with phalloidin (green) and DAPI (blue). (A, B’) Co-labeling of T/NK cells with an anti-ZAP70 antibody (red hot), and of proliferating cells with an anti-PCNA antibody (magenta). Proliferating T/NK cells in the ILT and ALT are highlighted by white arrows in (A, A’, B, B’). (C–E) Cryosections from rag2:DsRED zebrafish where cells going through V(D)J recombination are fluorescent (magenta hot). Expression of rag2 is very high within the thymus but only a few cells with low signal are present around the ILT and ALT (magenta arrowheads in (D, E). Images are maximum intensity projections: 2 µm (A–E). Annotations: Aa, Afferent artery; ALT, Amphibranchial Lymphoid Tissue; Bc, Branchial cavity; C, Cartilage; Ea, Efferent artery; Ga, Gill arch; ILT, Interbranchial Lymphoid Tissue and La, Lamella. Scale bars: 10 µm (A, B’), 20 μm (D, E) and 30 µm (C).

Acknowledgments
This image is the copyrighted work of the attributed author or publisher, and ZFIN has permission only to display this image to its users. Additional permissions should be obtained from the applicable author or publisher of the image. Full text @ Front Immunol