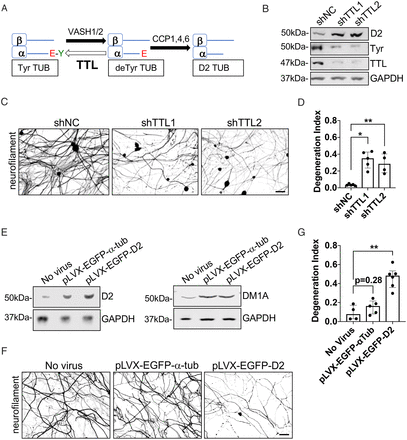
Fig. 5 D2 accumulation is sufficient to drive Bort-induced axonopathy. (A) Schematic of the enzymes involved in D2 generation. (B) Immunoblot analyses of TTL, D2, and tyrosinated tubulin levels in adult DRG neurons (12 DIV) silenced of TTL expression by lentiviral shRNA delivery (5 DIV). (C) Representative IF images of neurofilament staining in DRG neurons (12 DIV) silenced of TTL expression for 7 d by lentiviral shRNA delivery. (D) Axonal degeneration in DRG neurons treated as in C. Data are pooled from 4 to 5 experiments (6 to 16 fields per condition for each experiment). (E) Immunoblot analyses of D2 and α-tubulin (DM1A) levels in adult DRG neurons (12 DIV) expressing D2-(pLVX-EGFP- D2) or WT α-tubulin (pLVX-EGFP-α−tub) (5 DIV). GAPDH, loading control. (F) Representative IF images of neurofilament staining in DRG neurons (12 DIV) transduced with lentiviruses expressing D2-(pLVX-EGFP-D2) or WT α-tubulin (pLVX-EGFP-α-tub) for 7 d. (G) Axonal degeneration in DRG neurons treated as in F. All data in D and G are shown as medians plus interquartile range from 4 to 6 experiments (4 to 17 fields per condition for each experiment). Statistical significance was analyzed by Mann–Whitney U test. GAPDH, loading control. shNC, shRNA noncoding control. *P < 0.05, **P < 0.01. Scale bars in C and F, 50 μm.
Image
Figure Caption
Acknowledgments
This image is the copyrighted work of the attributed author or publisher, and
ZFIN has permission only to display this image to its users.
Additional permissions should be obtained from the applicable author or publisher of the image.
Full text @ Proc. Natl. Acad. Sci. USA

