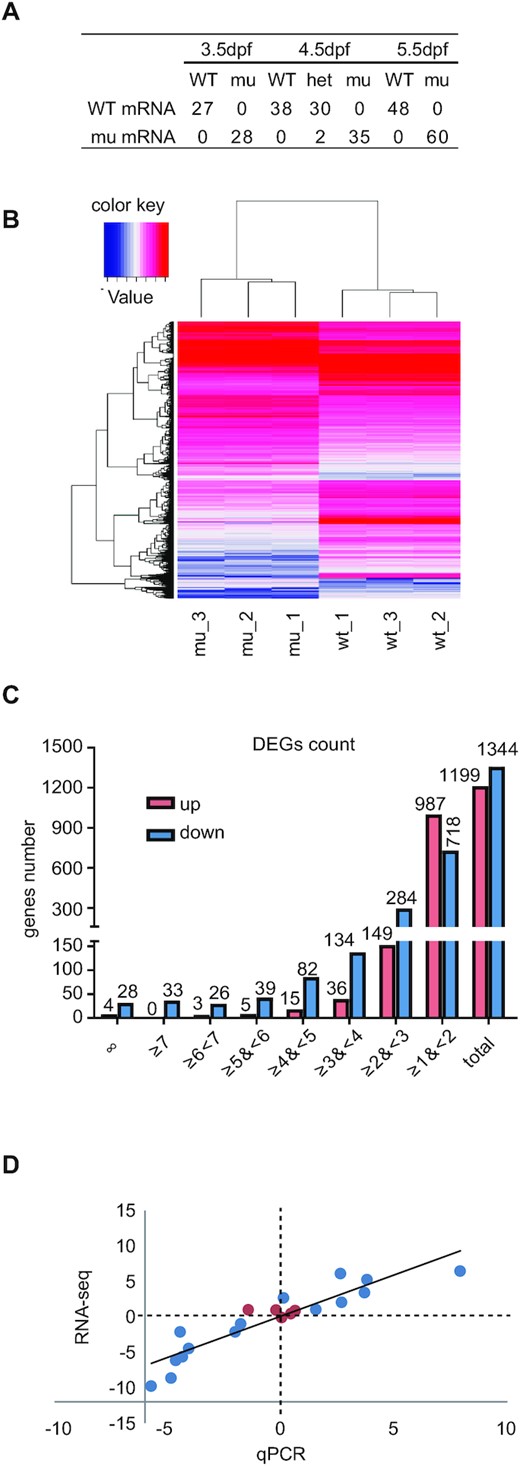
Fig. 6 Depletion of Rcl1 causes down-regulation of 1344 genes and up-regulation of 1199 gene. (A) Sequencing analysis of WT rcl1 and mutant rcl1zju1 transcripts in the RT-PCR products obtained from WT, rcl1zju1/+ heterozygous and rcl1zju1 homozygous progenies of the rcl1zju1/+ intercross at 3.5dpf, 4.5dpf and 5.5dpf. (B) Hierarchical Clustering analysis of the RNA-seq data between WT and rcl1zju1 mutant with three biological repeats. (C) The log2 value distributions of the 1,199 significant up-regulated and 1,344 down-regulated genes (cut-off value: log2≧|±1|, P <0.05) in rcl1zju1 mutant at 4.5dpf. (D) Confirmation of the RNA-seq data by the qPCR analysis of 20 randomly selected genes in WT and rcl1zju1 mutant. Expression data of genes detected by RNA-seq was plotted against those by qPCR. The reference line indicates the linear correlation between the RNA-seq and qPCR. Blue dot: gene with significant change in RNA-seq; red dot: gene without significant change.
Image
Figure Caption
Acknowledgments
This image is the copyrighted work of the attributed author or publisher, and
ZFIN has permission only to display this image to its users.
Additional permissions should be obtained from the applicable author or publisher of the image.
Full text @ Nucleic Acids Res.

