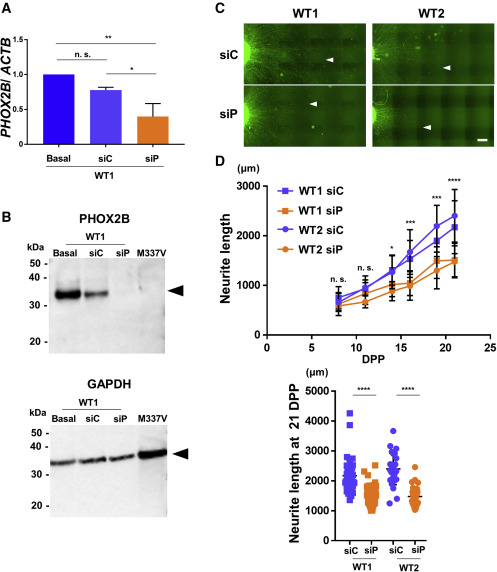
Fig. 6 (A) Control MNs were transfected with siP or siC at 3 dpp and RNA extracted at 7 dpp for expression analysis by qPCR. MNs transfected with siP showed an approximately 50% reduction in PHOX2B expression compared with MNs transfected with siC. Statistical analysis performed on n = 3 independent triplicates. One-way ANOVA with post hoc Tukey HSD tests. ∗∗p < 0.01, ∗p < 0.05. (B) Knockdown efficiency of PHOX2B by siRNA was examined by western blotting. The reduction in PHOX2B (32 kDa, arrowhead) was comparable with that observed in M337V TARDBP mutant MNs. GAPDH (37 kDa, arrowhead) was used as the gel loading control. (C) Knockdown of PHOX2B in healthy control MNs (WT1 and WT2) reduced neurite length compared with MNs transfected with siC at 21 dpp. The white arrowheads indicate the most distal neurite ends. Scale bar, 300 μm. (D) The upper graph shows neurite length changes over time. Twenty-five to 80 neurites were analyzed per group for one experiment, depending on the time post differentiation. A comparison between the siC and siP groups showed that the neurite length significantly decreased in the siP group from day 14. The lower graph shows quantitative analysis at 21 dpp. MNs transfected with siP significantly reduced neurite length compared with MNs transfected with siC at 21 dpp. Repeated measures ANOVA with post hoc Tukey HSD tests for comparison between siC and siP. Two-way ANOVA with post hoc Tukey HSD tests for among each cell lines. ∗p < 0.05, ∗∗p < 0.01, ∗∗∗p < 0.001, ∗∗∗∗p < 0.0001. See also Tables S2 and S3.
Image
Figure Caption
Acknowledgments
This image is the copyrighted work of the attributed author or publisher, and
ZFIN has permission only to display this image to its users.
Additional permissions should be obtained from the applicable author or publisher of the image.
Full text @ Stem Cell Reports

