Image
Figure Caption
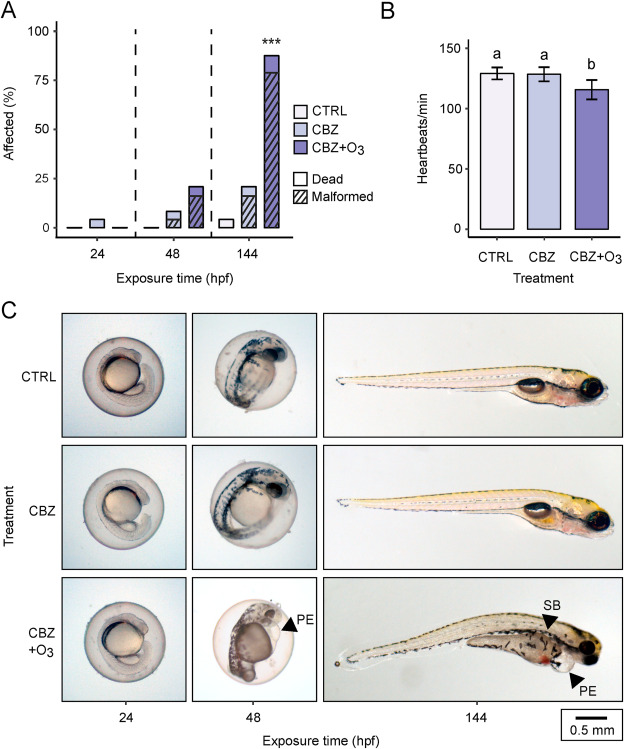
Fig. 2 (A) Embryo heart rate (heart beats per minute, mean ± sd) at 48 hpf (different letters indicate a significant deviation (p < 0.05, Tukey HSD test), (C) representative images of embryo-larvae in the three treatment groups at 24, 48, and 144 hpf with arrows indicating typical malformation (PE: pericardial edema, SB: lack of swim-bladder inflation), (D) proportion affected (dead and malformed) embryo-larvae at 24, 48, and 144 hpf (∗∗∗: p < 0.001 in Bonferroni adjusted Fisher’s exact test).
Figure Data
Acknowledgments
This image is the copyrighted work of the attributed author or publisher, and
ZFIN has permission only to display this image to its users.
Additional permissions should be obtained from the applicable author or publisher of the image.
Full text @ Chemosphere

