
|
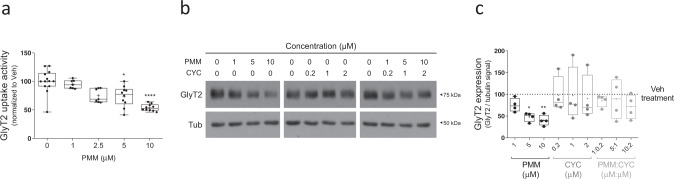
Fig. 2 a Primary brainstem and spinal cord neurons were treated with the concentrations of purmorphamine indicated for 16 h and glycine transport rates were measured using [3H]-glycine transport assays. Glycine transport shown is normalized against control conditions. *p (PMM 5 μM) = 0.0242, ****p (PMM 10 μM) < 0.0001, using Dunn’s multiple comparisons test, n (Veh) = 13, number of experiments n (PMM 1 μM) = 7, n (PMM 2.5 μM) = 7, n (PMM 5 μM) = 10, n (PMM 10 μM) = 10. b Representative immunoblot of primary brainstem and spinal cord neurons. Cells were treated with purmorphamine or/and cyclopamine at the concentrations indicated and the expression of GlyT2 was analyzed by immunoblotting after 16 h. Tubulin is used as protein loading control. c Quantification of GlyT2 expression is normalized to the corrected signal against tubulin. *p (Veh vs PMM 5 μM) = 0.0248, **p (Veh vs PMM 10 μM) = 0.0098, nsp (Veh vs PMM 1 μM + CYC 0.2 μM) > 0.9999, nsp (Veh vs PMM 5 μM + CYC 1 μM) > 0.9999, nsp (Veh vs PMM 10 μM + CYC 2 μM) > 0.9999, using Dunn’s multiple comparisons test; number of experiments n = 4. PMM purmorphamine, CYC cyclopamine.